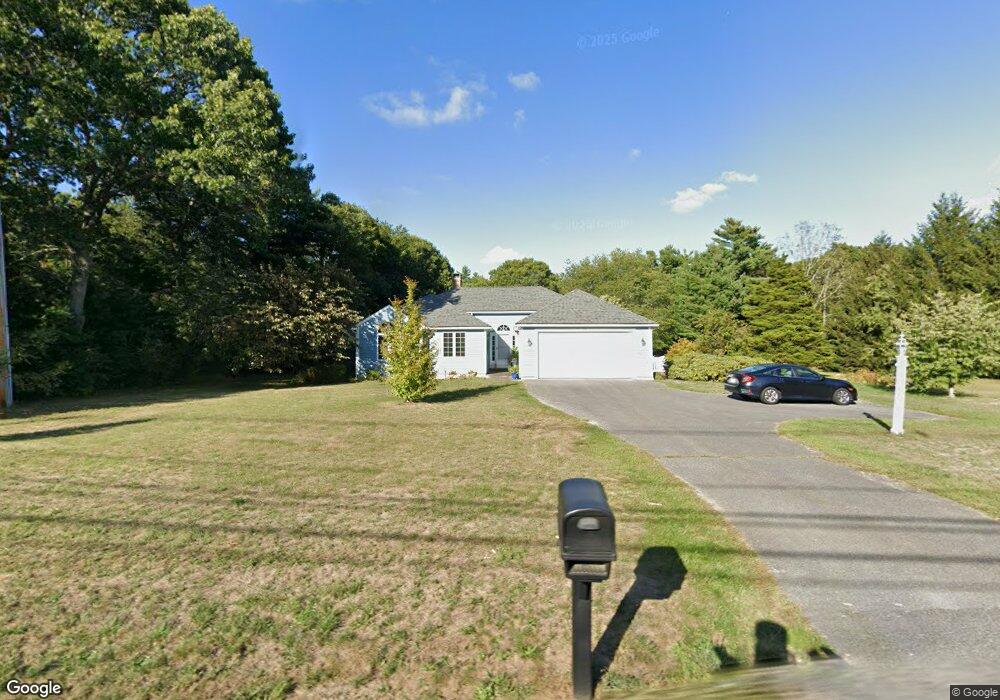
138 Rocky Meadow St Middleboro, MA 02346
Estimated Value: $579,000 - $650,639
3
Beds
2
Baths
1,619
Sq Ft
$376/Sq Ft
Est. Value
About This Home
This home is located at 138 Rocky Meadow St, Middleboro, MA 02346 and is currently estimated at $609,213, approximately $376 per square foot. 138 Rocky Meadow St is a home located in Plymouth County with nearby schools including Mary K. Goode Elementary School and Samuel Fuller School.
Ownership History
Date
Name
Owned For
Owner Type
Purchase Details
Closed on
Aug 5, 2021
Sold by
Dolan Kathleen E
Bought by
Marshall Nancy L and Dolan Kathleen E
Current Estimated Value
Home Financials for this Owner
Home Financials are based on the most recent Mortgage that was taken out on this home.
Original Mortgage
$150,000
Outstanding Balance
$112,608
Interest Rate
2.3%
Mortgage Type
New Conventional
Estimated Equity
$496,605
Purchase Details
Closed on
Jan 26, 2010
Sold by
Johnson Karin E and Dolan Kathleen
Bought by
Dolan Kathleen E
Home Financials for this Owner
Home Financials are based on the most recent Mortgage that was taken out on this home.
Original Mortgage
$250,000
Interest Rate
4.79%
Mortgage Type
Purchase Money Mortgage
Purchase Details
Closed on
Jul 13, 1998
Sold by
Romsey Patricia H and Romsey Charles A
Bought by
Johnson Karin E and Dolan Kathleen
Create a Home Valuation Report for This Property
The Home Valuation Report is an in-depth analysis detailing your home's value as well as a comparison with similar homes in the area
Home Values in the Area
Average Home Value in this Area
Purchase History
| Date | Buyer | Sale Price | Title Company |
|---|---|---|---|
| Marshall Nancy L | -- | None Available | |
| Marshall Nancy L | -- | None Available | |
| Dolan Kathleen E | -- | -- | |
| Dolan Kathleen E | -- | -- | |
| Johnson Karin E | $79,900 | -- | |
| Dolan Kathleen E | -- | -- | |
| Johnson Karin E | $79,900 | -- |
Source: Public Records
Mortgage History
| Date | Status | Borrower | Loan Amount |
|---|---|---|---|
| Open | Marshall Nancy L | $150,000 | |
| Closed | Marshall Nancy L | $150,000 | |
| Previous Owner | Dolan Kathleen E | $250,000 | |
| Previous Owner | Johnson Karin E | $85,000 |
Source: Public Records
Tax History Compared to Growth
Tax History
| Year | Tax Paid | Tax Assessment Tax Assessment Total Assessment is a certain percentage of the fair market value that is determined by local assessors to be the total taxable value of land and additions on the property. | Land | Improvement |
|---|---|---|---|---|
| 2025 | $7,916 | $590,300 | $177,300 | $413,000 |
| 2024 | $7,570 | $559,100 | $169,300 | $389,800 |
| 2023 | $7,017 | $492,800 | $169,300 | $323,500 |
| 2022 | $6,701 | $435,700 | $147,700 | $288,000 |
| 2021 | $6,625 | $407,200 | $129,200 | $278,000 |
| 2020 | $6,236 | $392,700 | $129,200 | $263,500 |
| 2019 | $5,850 | $377,900 | $129,200 | $248,700 |
| 2018 | $5,432 | $348,200 | $123,000 | $225,200 |
| 2017 | $5,340 | $338,600 | $118,400 | $220,200 |
| 2016 | $5,502 | $345,600 | $112,400 | $233,200 |
| 2015 | $5,184 | $328,500 | $117,800 | $210,700 |
Source: Public Records
Map
Nearby Homes
- 134 Rocky Meadow St
- 139 Rocky Meadow St
- 144 Rocky Meadow St
- 137 Rocky Meadow St
- 143 Rocky Meadow St
- 135 Rocky Meadow St
- 132 Rocky Meadow St
- 130 Rocky Meadow St
- 145 Rocky Meadow St
- 131 Rocky Meadow St
- 147 Rocky Meadow St
- 148 Rocky Meadow St
- 128 Rocky Meadow St
- 129 Rocky Meadow St
- 149 Rocky Meadow St
- 150 Rocky Meadow St
- 126 Rocky Meadow St
- 127 Rocky Meadow St
- 151 Rocky Meadow St
- 125 Rocky Meadow St