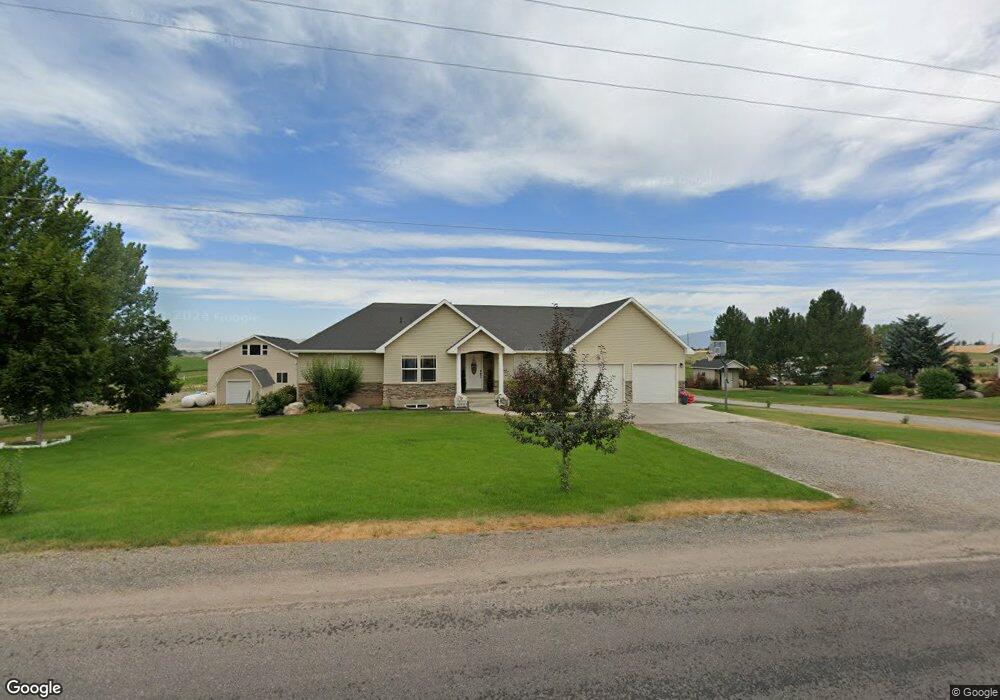
138 S 2600 E Preston, ID 83263
Estimated Value: $637,000 - $694,000
5
Beds
3
Baths
3,668
Sq Ft
$181/Sq Ft
Est. Value
About This Home
This home is located at 138 S 2600 E, Preston, ID 83263 and is currently estimated at $662,101, approximately $180 per square foot. 138 S 2600 E is a home located in Franklin County with nearby schools including Pioneer Elementary School, Oakwood Elementary School, and Preston Junior High School.
Ownership History
Date
Name
Owned For
Owner Type
Purchase Details
Closed on
Oct 31, 2018
Sold by
Mockli Ray and Mockli Cathy Rae
Bought by
Moser Shad K and Moser Heidie
Current Estimated Value
Home Financials for this Owner
Home Financials are based on the most recent Mortgage that was taken out on this home.
Original Mortgage
$321,600
Interest Rate
4.5%
Mortgage Type
New Conventional
Purchase Details
Closed on
Sep 14, 2018
Sold by
Moser Shad K and Moser Heidie K
Bought by
Hirschi Ryan and Hirschi Danielle
Home Financials for this Owner
Home Financials are based on the most recent Mortgage that was taken out on this home.
Original Mortgage
$321,600
Interest Rate
4.5%
Mortgage Type
New Conventional
Purchase Details
Closed on
Aug 10, 2005
Sold by
Moser Edward C and Moser Connie
Bought by
Moser Shad K and Moser Heidie K
Home Financials for this Owner
Home Financials are based on the most recent Mortgage that was taken out on this home.
Original Mortgage
$5,129,810
Interest Rate
5.48%
Mortgage Type
Construction
Create a Home Valuation Report for This Property
The Home Valuation Report is an in-depth analysis detailing your home's value as well as a comparison with similar homes in the area
Purchase History
| Date | Buyer | Sale Price | Title Company |
|---|---|---|---|
| Moser Shad K | -- | None Available | |
| Hirschi Ryan | -- | Northern Title Co | |
| Moser Shad K | -- | -- | |
| Moser Shad K | -- | -- |
Source: Public Records
Mortgage History
| Date | Status | Borrower | Loan Amount |
|---|---|---|---|
| Previous Owner | Hirschi Ryan | $321,600 | |
| Previous Owner | Moser Shad K | $5,129,810 |
Source: Public Records
Tax History
| Year | Tax Paid | Tax Assessment Tax Assessment Total Assessment is a certain percentage of the fair market value that is determined by local assessors to be the total taxable value of land and additions on the property. | Land | Improvement |
|---|---|---|---|---|
| 2025 | $2,023 | $552,354 | $65,292 | $487,062 |
| 2024 | $2,184 | $547,064 | $65,292 | $481,772 |
| 2023 | $2,104 | $551,640 | $65,292 | $486,348 |
| 2022 | $2,709 | $500,711 | $35,960 | $464,751 |
| 2021 | $2,486 | $455,463 | $35,960 | $419,503 |
| 2019 | $2,608 | $377,336 | $35,960 | $341,376 |
| 2018 | $1,650 | $254,697 | $30,500 | $224,197 |
| 2017 | $1,733 | $256,871 | $30,500 | $226,371 |
| 2016 | $1,765 | $245,250 | $30,500 | $214,750 |
| 2015 | $1,818 | $248,430 | $30,500 | $217,930 |
| 2014 | $25,918 | $237,990 | $29,500 | $208,490 |
| 2013 | $22,433 | $237,990 | $29,500 | $208,490 |
Source: Public Records
Map
Nearby Homes
Your Personal Tour Guide
Ask me questions while you tour the home.