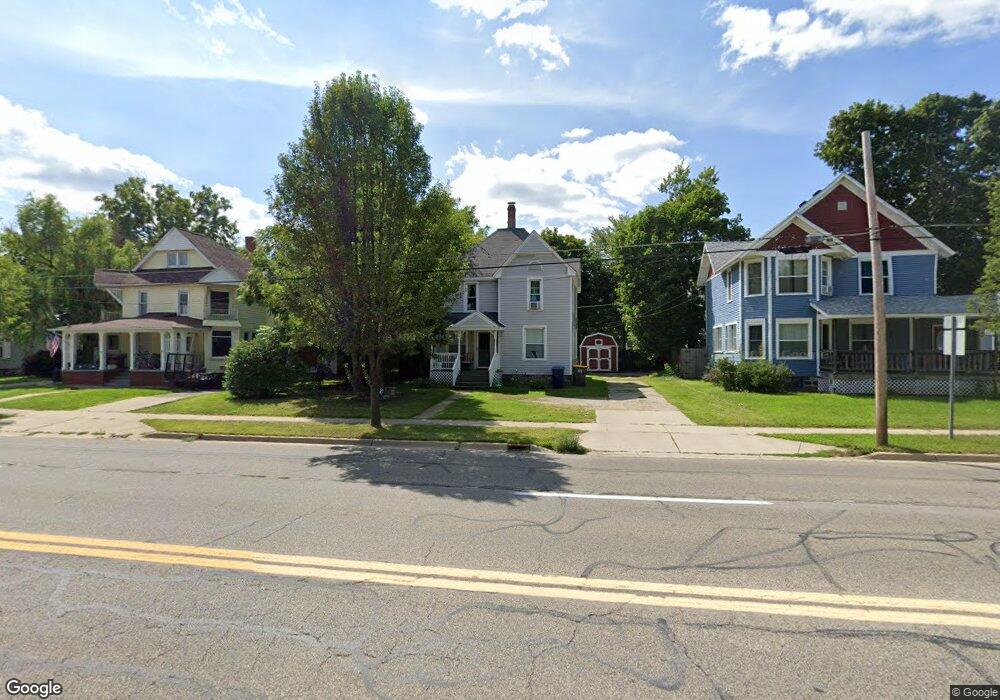
138 S Broad St Hillsdale, MI 49242
Estimated Value: $141,000 - $190,000
--
Bed
1
Bath
899
Sq Ft
$191/Sq Ft
Est. Value
About This Home
This home is located at 138 S Broad St, Hillsdale, MI 49242 and is currently estimated at $171,413, approximately $190 per square foot. 138 S Broad St is a home located in Hillsdale County with nearby schools including Bailey Early Childhood Center, Gier Elementary School, and Davis Middle School.
Ownership History
Date
Name
Owned For
Owner Type
Purchase Details
Closed on
Jul 8, 2024
Sold by
Taipalus Properties Llc
Bought by
Sandahl Joseph W and Sandahl Caitlin M
Current Estimated Value
Purchase Details
Closed on
Apr 29, 2015
Sold by
Parker Cynthia Reh and Parker John Eric
Bought by
Taipalus Jonathan
Purchase Details
Closed on
Aug 7, 2003
Sold by
Parker Susan L
Bought by
Parker John Eric
Purchase Details
Closed on
Jul 12, 2000
Sold by
Parker Paul M and Parker Helen J
Bought by
Parker John Eric
Purchase Details
Closed on
Feb 6, 1980
Bought by
Parker Paul and Parker Helen
Create a Home Valuation Report for This Property
The Home Valuation Report is an in-depth analysis detailing your home's value as well as a comparison with similar homes in the area
Home Values in the Area
Average Home Value in this Area
Purchase History
| Date | Buyer | Sale Price | Title Company |
|---|---|---|---|
| Sandahl Joseph W | $120,000 | None Listed On Document | |
| Taipalus Jonathan | $7,500 | None Available | |
| Parker John Eric | -- | -- | |
| Parker John Eric | $10,000 | -- | |
| Parker Paul | $15,900 | -- |
Source: Public Records
Tax History Compared to Growth
Tax History
| Year | Tax Paid | Tax Assessment Tax Assessment Total Assessment is a certain percentage of the fair market value that is determined by local assessors to be the total taxable value of land and additions on the property. | Land | Improvement |
|---|---|---|---|---|
| 2025 | $1,782 | $94,100 | $0 | $0 |
| 2024 | $1,491 | $42,800 | $0 | $0 |
| 2023 | $968 | $38,700 | $0 | $0 |
| 2022 | $1,253 | $34,000 | $0 | $0 |
| 2021 | $1,224 | $28,700 | $0 | $0 |
| 2020 | $1,193 | $28,500 | $0 | $0 |
| 2019 | $1,163 | $30,000 | $0 | $0 |
| 2018 | $1,101 | $25,900 | $0 | $0 |
| 2017 | $1,069 | $20,400 | $0 | $0 |
| 2016 | $1,004 | $21,300 | $0 | $0 |
| 2015 | $719 | $21,300 | $0 | $0 |
| 2013 | -- | $19,870 | $0 | $0 |
| 2012 | -- | $18,760 | $0 | $0 |
Source: Public Records
Map
Nearby Homes