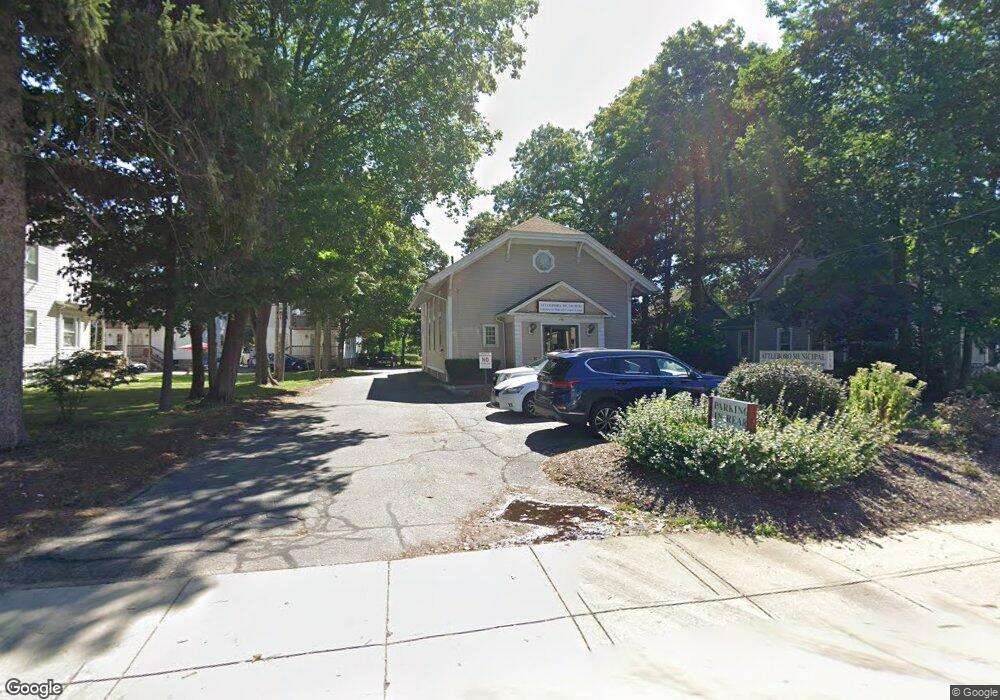
138 S Main St Attleboro, MA 02703
Estimated Value: $841,865
4
Beds
2
Baths
2,768
Sq Ft
$304/Sq Ft
Est. Value
About This Home
This home is located at 138 S Main St, Attleboro, MA 02703 and is currently estimated at $841,865, approximately $304 per square foot. 138 S Main St is a home located in Bristol County with nearby schools including Hyman Fine Elementary School, Cyril K. Brennan Middle School, and Attleboro High School.
Ownership History
Date
Name
Owned For
Owner Type
Purchase Details
Closed on
Oct 12, 2001
Sold by
Acorn Assoc 28 Nt
Bought by
Efcu Attleboro Mun
Current Estimated Value
Purchase Details
Closed on
Jul 10, 2001
Sold by
Stebbings Arthur A
Bought by
Acorn Assoc 28 Nt
Home Financials for this Owner
Home Financials are based on the most recent Mortgage that was taken out on this home.
Original Mortgage
$250,000
Interest Rate
7.21%
Mortgage Type
Commercial
Create a Home Valuation Report for This Property
The Home Valuation Report is an in-depth analysis detailing your home's value as well as a comparison with similar homes in the area
Home Values in the Area
Average Home Value in this Area
Purchase History
| Date | Buyer | Sale Price | Title Company |
|---|---|---|---|
| Efcu Attleboro Mun | $280,000 | -- | |
| Acorn Assoc 28 Nt | $250,000 | -- |
Source: Public Records
Mortgage History
| Date | Status | Borrower | Loan Amount |
|---|---|---|---|
| Previous Owner | Acorn Assoc 28 Nt | $250,000 | |
| Previous Owner | Acorn Assoc 28 Nt | $150,000 |
Source: Public Records
Tax History Compared to Growth
Tax History
| Year | Tax Paid | Tax Assessment Tax Assessment Total Assessment is a certain percentage of the fair market value that is determined by local assessors to be the total taxable value of land and additions on the property. | Land | Improvement |
|---|---|---|---|---|
| 2025 | $10,373 | $557,100 | $158,400 | $398,700 |
| 2024 | $10,830 | $563,500 | $158,400 | $405,100 |
| 2023 | $11,552 | $569,900 | $158,400 | $411,500 |
| 2022 | $12,177 | $576,300 | $158,400 | $417,900 |
| 2021 | $4,677 | $455,300 | $148,000 | $307,300 |
| 2020 | $4,646 | $452,700 | $140,800 | $311,900 |
| 2019 | $9,371 | $463,900 | $140,800 | $323,100 |
| 2018 | $8,268 | $464,500 | $136,700 | $327,800 |
| 2017 | $9,586 | $469,200 | $136,700 | $332,500 |
| 2016 | $9,900 | $462,200 | $136,700 | $325,500 |
| 2015 | $9,945 | $466,700 | $136,700 | $330,000 |
| 2014 | $10,113 | $468,400 | $136,700 | $331,700 |
Source: Public Records
Map
Nearby Homes
- 130 S Main St
- 134 S Main St Unit 2
- 142 S Main St
- 126 S Main St
- 143 Union St
- 141 S Main St
- 139 Union St
- 135 Union St Unit 1
- 135 Union St
- 133 Union St
- 154 S Main St
- 147 S Main St
- 147 S Main St Unit 2
- 127 Union St
- 133 S Main St Unit 1-6
- 133 S Main St Unit 3
- 133 S Main St
- 167 S Main St Unit 1
- 118 S Main St
- 153 S Main St