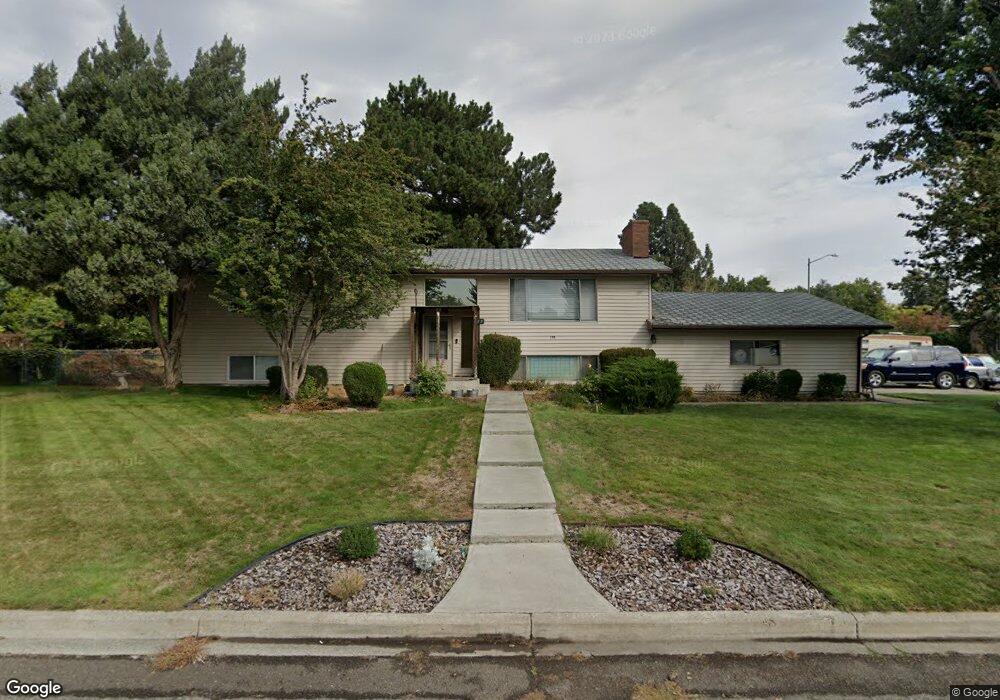
138 Spring St Richland, WA 99354
Estimated Value: $538,112 - $609,000
4
Beds
2
Baths
3,024
Sq Ft
$190/Sq Ft
Est. Value
About This Home
This home is located at 138 Spring St, Richland, WA 99354 and is currently estimated at $573,778, approximately $189 per square foot. 138 Spring St is a home located in Benton County with nearby schools including Jefferson Elementary School, Chief Joseph Middle School, and Hanford High School.
Ownership History
Date
Name
Owned For
Owner Type
Purchase Details
Closed on
Oct 19, 2021
Sold by
Walker Jeff and Alandt Elizabeth
Bought by
Walker John
Current Estimated Value
Home Financials for this Owner
Home Financials are based on the most recent Mortgage that was taken out on this home.
Original Mortgage
$348,000
Interest Rate
2.8%
Mortgage Type
New Conventional
Purchase Details
Closed on
Oct 14, 2021
Sold by
Walker John L
Bought by
Walker John L and Walker Coral A
Home Financials for this Owner
Home Financials are based on the most recent Mortgage that was taken out on this home.
Original Mortgage
$348,000
Interest Rate
2.8%
Mortgage Type
New Conventional
Purchase Details
Closed on
Sep 20, 2021
Sold by
Walker Joan Alison and Estate Of Joan Alison Walker
Bought by
Walker Jeff and Walker John
Home Financials for this Owner
Home Financials are based on the most recent Mortgage that was taken out on this home.
Original Mortgage
$348,000
Interest Rate
2.8%
Mortgage Type
New Conventional
Purchase Details
Closed on
Jun 11, 2021
Sold by
Walker Joan Alison
Bought by
Walker Jeff and Walker John
Create a Home Valuation Report for This Property
The Home Valuation Report is an in-depth analysis detailing your home's value as well as a comparison with similar homes in the area
Home Values in the Area
Average Home Value in this Area
Purchase History
| Date | Buyer | Sale Price | Title Company |
|---|---|---|---|
| Walker John | -- | Cascade Title Company | |
| Walker John L | -- | Cascade Title Company | |
| Walker Jeff | -- | None Available | |
| Walker Jeff | -- | None Available |
Source: Public Records
Mortgage History
| Date | Status | Borrower | Loan Amount |
|---|---|---|---|
| Closed | Walker John L | $348,000 |
Source: Public Records
Tax History Compared to Growth
Tax History
| Year | Tax Paid | Tax Assessment Tax Assessment Total Assessment is a certain percentage of the fair market value that is determined by local assessors to be the total taxable value of land and additions on the property. | Land | Improvement |
|---|---|---|---|---|
| 2024 | $4,263 | $465,820 | $50,000 | $415,820 |
| 2023 | $4,263 | $455,160 | $50,000 | $405,160 |
| 2022 | $3,853 | $391,180 | $50,000 | $341,180 |
| 2021 | $3,644 | $348,540 | $50,000 | $298,540 |
| 2020 | $574 | $316,550 | $50,000 | $266,550 |
| 2019 | $596 | $300,610 | $48,000 | $252,610 |
| 2018 | $633 | $272,540 | $48,000 | $224,540 |
| 2017 | $2,801 | $235,120 | $48,000 | $187,120 |
| 2016 | $2,761 | $235,120 | $48,000 | $187,120 |
| 2015 | $2,813 | $235,120 | $48,000 | $187,120 |
| 2014 | -- | $235,120 | $48,000 | $187,120 |
| 2013 | -- | $235,120 | $48,000 | $187,120 |
Source: Public Records
Map
Nearby Homes
- 2509 Albemarle Ct
- 2445 Westmoreland Dr
- 2462 Mullet Ct
- 2342 Davison Ave
- 721 Hanford St
- 42 Mercury Dr
- 49 Galaxy Ln
- 49 Proton Ln
- 324 Saint St
- 45 Cosmic Ln
- 50 Compton Ln Unit 51
- 49 Compton Ln
- 21 Nuclear Ln
- Lot 1 Trail
- Lot 2 Nka John Mullen Trail
- Lot 3 Nka John Mullen Trail
- 901 W Currie St
- NKA John Mullen Trail
- 733 Snyder St
- Lot 11 Nka Limousin Ln
- 2513 Allegheny Ct
- 150 Spring St
- 2512 Davison Ave
- 147 Spring St
- 137 Spring St
- 132 Spring St
- 2519 Allegheny Ct
- 2510 Allegheny Ct
- 153 Spring St
- 2518 Davison Ave
- 2516 Allegheny Ct Unit North Richland Rambl
- 2516 Allegheny Ct Unit Walking distance to
- 2516 Allegheny Ct
- 2525 Allegheny Ct
- 138 Patton St
- 144 Patton St
- 129 Spring St
- 126 Spring St
- 132 Patton St
- 2524 Davison Ave