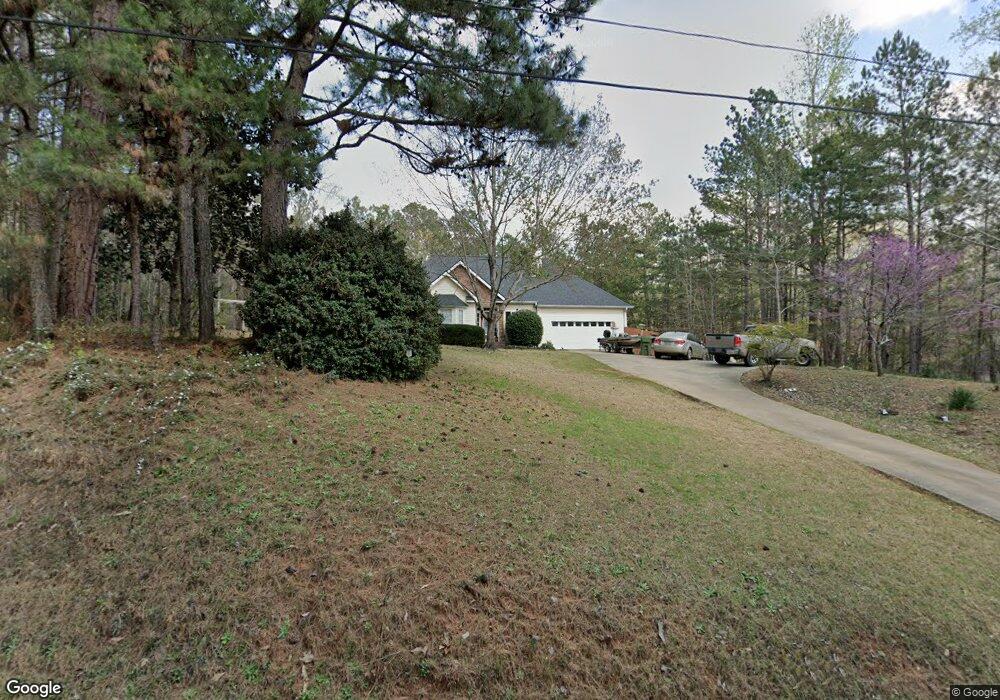
138 Thornton Rd Franklin, GA 30217
Estimated Value: $252,391 - $310,000
3
Beds
2
Baths
1,481
Sq Ft
$188/Sq Ft
Est. Value
About This Home
This home is located at 138 Thornton Rd, Franklin, GA 30217 and is currently estimated at $278,098, approximately $187 per square foot. 138 Thornton Rd is a home located in Troup County with nearby schools including Hillcrest Elementary School, Franklin Forest Elementary School, and Hollis Hand Elementary School.
Ownership History
Date
Name
Owned For
Owner Type
Purchase Details
Closed on
Sep 28, 2018
Sold by
Pinkerman Loren L
Bought by
Busby Bruce L and Busby Nora E
Current Estimated Value
Home Financials for this Owner
Home Financials are based on the most recent Mortgage that was taken out on this home.
Original Mortgage
$114,000
Outstanding Balance
$99,415
Interest Rate
4.5%
Mortgage Type
New Conventional
Estimated Equity
$178,683
Purchase Details
Closed on
Nov 1, 2001
Sold by
Lewis C Davis Jr Inc
Bought by
Pinkerman Loren L and Pinkerman Patricia A
Purchase Details
Closed on
Aug 15, 2001
Sold by
Michael Gerling
Bought by
Lewis C Davis Jr Inc
Purchase Details
Closed on
Nov 16, 1999
Sold by
Beaver Run Properties Llc
Bought by
Michael Gerling
Purchase Details
Closed on
Mar 27, 1998
Sold by
Weyerhaeuser Real
Bought by
Beaver Run Properties Llc
Create a Home Valuation Report for This Property
The Home Valuation Report is an in-depth analysis detailing your home's value as well as a comparison with similar homes in the area
Home Values in the Area
Average Home Value in this Area
Purchase History
| Date | Buyer | Sale Price | Title Company |
|---|---|---|---|
| Busby Bruce L | $142,500 | -- | |
| Pinkerman Loren L | $130,000 | -- | |
| Lewis C Davis Jr Inc | $5,000 | -- | |
| Michael Gerling | -- | -- | |
| Beaver Run Properties Llc | -- | -- |
Source: Public Records
Mortgage History
| Date | Status | Borrower | Loan Amount |
|---|---|---|---|
| Open | Busby Bruce L | $114,000 |
Source: Public Records
Tax History Compared to Growth
Tax History
| Year | Tax Paid | Tax Assessment Tax Assessment Total Assessment is a certain percentage of the fair market value that is determined by local assessors to be the total taxable value of land and additions on the property. | Land | Improvement |
|---|---|---|---|---|
| 2024 | $1,777 | $67,160 | $7,200 | $59,960 |
| 2023 | $1,792 | $67,680 | $7,200 | $60,480 |
| 2022 | $1,765 | $65,240 | $7,200 | $58,040 |
| 2021 | $1,751 | $60,040 | $4,240 | $55,800 |
| 2020 | $1,399 | $48,360 | $5,480 | $42,880 |
| 2019 | $1,420 | $49,080 | $5,480 | $43,600 |
| 2018 | $1,300 | $45,080 | $5,480 | $39,600 |
| 2017 | $1,300 | $45,080 | $5,480 | $39,600 |
| 2016 | $1,281 | $44,454 | $5,500 | $38,954 |
| 2015 | $1,283 | $44,454 | $5,500 | $38,954 |
| 2014 | $1,200 | $41,626 | $5,500 | $36,126 |
| 2013 | -- | $43,536 | $5,500 | $38,036 |
Source: Public Records
Map
Nearby Homes
- 65 Indian Bend Dr
- 4555 Mooty Bridge Rd
- 155 Indian Bend Dr
- 183 Indian Bend Dr
- 0 Bevis Rd Parcel 7 Unit 10559612
- 0 Tower Rd
- 0 River Club Dr Unit 10311961
- 181 S Chattahoochee Dr
- 0 Tbd Tower Rd
- 224 Riverbend Dr
- 305 Edgemont Dr
- 4 Grayson Point
- 151 Hubbard Rd
- 45+/- Ac Noles Rd
- 1480 Liberty Hill Rd
- 51+/- AC Noles Rd
- 45+/- AC Noles Rd
- 51+/- Ac Noles Rd
- 57 Hubbard Rd
- 50 Fish Camp
- 122 Thornton Rd
- 0 Thornton Rd Unit 8433431
- 0 Thornton Rd Unit 8393936
- 0 Thornton Rd Unit 8003307
- 0 Thornton Rd Unit 7546776
- 131 Thornton Rd
- 102 Thornton Rd
- 105 Thornton Rd
- 86 Thornton Rd
- 68 Thornton Rd
- 85 Thornton Rd
- 199 Thornton Rd
- 50 Thornton Rd
- 61 Thornton Rd
- 5801 Moody Bridge Rd
- 5815 Moody Bridge Rd
- 5864 Moody Bridge Rd
- 5387 Moody Bridge Rd
- 5946 Moody Bridge Rd
- 6004 Moody Bridge Rd