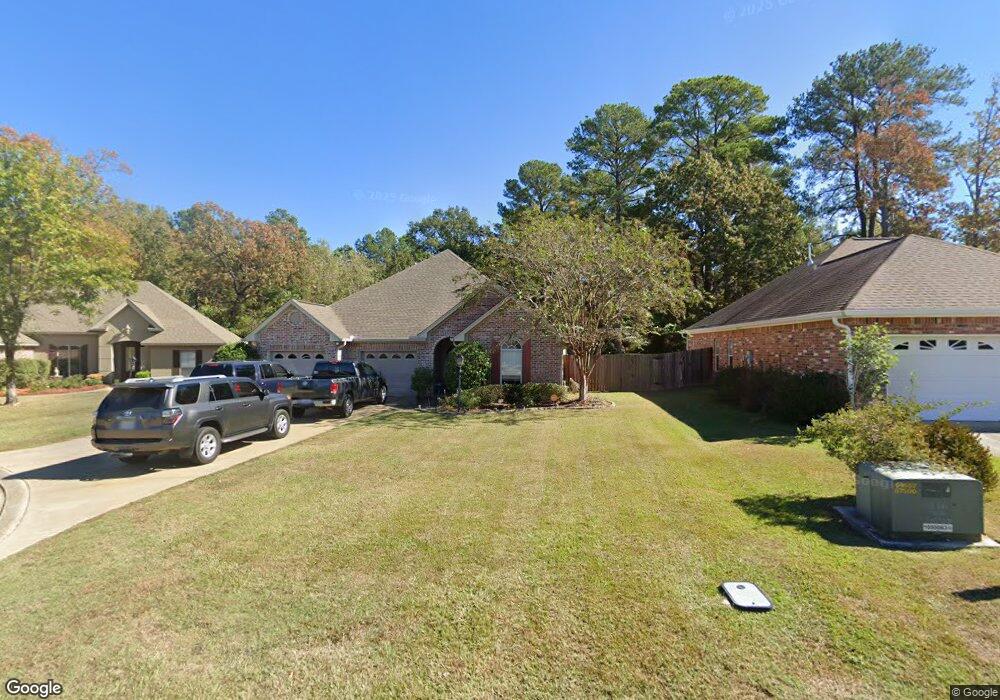
138 Watson Cir West Monroe, LA 71291
Claiborne NeighborhoodEstimated Value: $289,000 - $324,000
3
Beds
2
Baths
1,934
Sq Ft
$157/Sq Ft
Est. Value
About This Home
This home is located at 138 Watson Cir, West Monroe, LA 71291 and is currently estimated at $302,677, approximately $156 per square foot. 138 Watson Cir is a home located in Ouachita Parish with nearby schools including Claiborne School, West Monroe High School, and Northeast Baptist School.
Ownership History
Date
Name
Owned For
Owner Type
Purchase Details
Closed on
Jul 25, 2013
Sold by
Dunn Todd Edward
Bought by
Wiggins Lisa Delrio
Current Estimated Value
Home Financials for this Owner
Home Financials are based on the most recent Mortgage that was taken out on this home.
Original Mortgage
$243,877
Outstanding Balance
$178,428
Interest Rate
3.99%
Mortgage Type
New Conventional
Estimated Equity
$124,249
Purchase Details
Closed on
Oct 20, 2006
Sold by
Stratford Dunn Elizabeth Ann
Bought by
Dunn Todd Edward
Home Financials for this Owner
Home Financials are based on the most recent Mortgage that was taken out on this home.
Original Mortgage
$132,000
Interest Rate
6.19%
Mortgage Type
New Conventional
Purchase Details
Closed on
Jan 13, 2006
Sold by
Kovac Construction Inc
Bought by
Dunn Elizabeth Ann Stratford
Purchase Details
Closed on
Jun 27, 2005
Sold by
Kovac Bennett Inc
Bought by
Kovac Contruction Inc
Create a Home Valuation Report for This Property
The Home Valuation Report is an in-depth analysis detailing your home's value as well as a comparison with similar homes in the area
Home Values in the Area
Average Home Value in this Area
Purchase History
| Date | Buyer | Sale Price | Title Company |
|---|---|---|---|
| Wiggins Lisa Delrio | $244,000 | Mullens Price North Delta Ti | |
| Dunn Todd Edward | $192,000 | None Available | |
| Dunn Elizabeth Ann Stratford | $192,000 | None Available | |
| Kovac Contruction Inc | $30,000 | None Available |
Source: Public Records
Mortgage History
| Date | Status | Borrower | Loan Amount |
|---|---|---|---|
| Open | Wiggins Lisa Delrio | $243,877 | |
| Previous Owner | Dunn Todd Edward | $132,000 |
Source: Public Records
Tax History Compared to Growth
Tax History
| Year | Tax Paid | Tax Assessment Tax Assessment Total Assessment is a certain percentage of the fair market value that is determined by local assessors to be the total taxable value of land and additions on the property. | Land | Improvement |
|---|---|---|---|---|
| 2024 | $1,833 | $26,770 | $2,950 | $23,820 |
| 2023 | $1,833 | $25,262 | $2,950 | $22,312 |
| 2022 | $2,304 | $25,262 | $2,950 | $22,312 |
| 2021 | $2,257 | $24,423 | $2,950 | $21,473 |
| 2020 | $2,257 | $24,423 | $2,950 | $21,473 |
| 2019 | $2,250 | $24,423 | $2,950 | $21,473 |
| 2018 | $1,516 | $24,423 | $2,950 | $21,473 |
| 2017 | $1,720 | $19,200 | $3,000 | $16,200 |
| 2016 | $1,719 | $19,200 | $3,000 | $16,200 |
| 2015 | $1,045 | $19,200 | $3,000 | $16,200 |
| 2014 | $1,045 | $19,200 | $3,000 | $16,200 |
| 2013 | $1,042 | $19,200 | $3,000 | $16,200 |
Source: Public Records
Map
Nearby Homes
- 106 Sadie Ln
- 121 Hillcrest Ave
- 502 Wallace Rd
- 260 Defreese Rd Unit Wallace Dean Roa
- 146 Hillcrest Ave
- 221 Westside Dr
- 298 Defreese Rd
- 735 Wallace Dean Rd
- 113 Crocker Ln
- 429 Laird St
- 439 Laird St
- 2211 Wellerman Rd
- 115 Wellington Place
- 00 Avant Rd
- 0000 Avant Rd
- 302 Paula Dr
- 212 Paula Dr
- 3709 Cypress St Unit Tract 3
- 117 Carriage Way
- Roses V C Plan at Chloe Estates