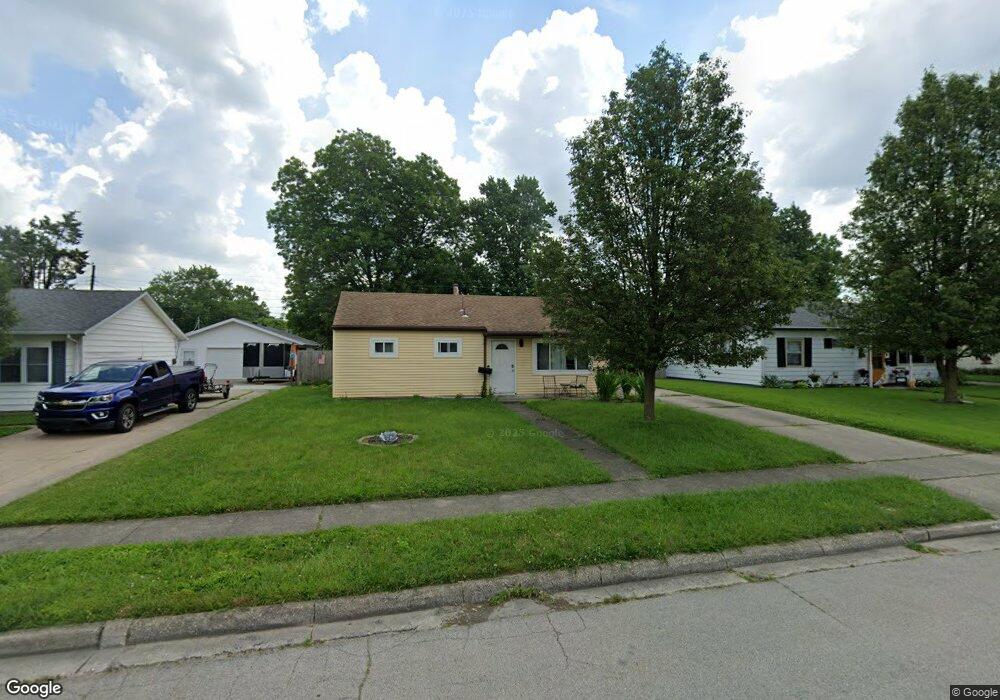
138 Westhafer Rd Vandalia, OH 45377
Estimated Value: $170,000 - $178,000
3
Beds
1
Bath
1,091
Sq Ft
$160/Sq Ft
Est. Value
About This Home
This home is located at 138 Westhafer Rd, Vandalia, OH 45377 and is currently estimated at $174,347, approximately $159 per square foot. 138 Westhafer Rd is a home located in Montgomery County with nearby schools including Demmitt Elementary School, Smith Middle School, and Butler High School.
Ownership History
Date
Name
Owned For
Owner Type
Purchase Details
Closed on
Mar 14, 2023
Sold by
Mallinger Brandon A and Dauter Leah M
Bought by
Malinger Brandon A
Current Estimated Value
Purchase Details
Closed on
Dec 8, 2022
Sold by
Dauter Leah M
Bought by
Mallinger Brandon A
Home Financials for this Owner
Home Financials are based on the most recent Mortgage that was taken out on this home.
Original Mortgage
$87,400
Interest Rate
5.75%
Mortgage Type
FHA
Purchase Details
Closed on
Sep 7, 2018
Sold by
Reynolds Kathleen Diane and Estate Of Norma J Kuhn
Bought by
Mallinger Brandon A and Dauter Leah M
Home Financials for this Owner
Home Financials are based on the most recent Mortgage that was taken out on this home.
Original Mortgage
$77,569
Interest Rate
5.12%
Mortgage Type
FHA
Create a Home Valuation Report for This Property
The Home Valuation Report is an in-depth analysis detailing your home's value as well as a comparison with similar homes in the area
Home Values in the Area
Average Home Value in this Area
Purchase History
| Date | Buyer | Sale Price | Title Company |
|---|---|---|---|
| Malinger Brandon A | $38,800 | Boston National Title | |
| Mallinger Brandon A | $7,000 | None Listed On Document | |
| Mallinger Brandon A | $79,000 | American Title Resources Inc |
Source: Public Records
Mortgage History
| Date | Status | Borrower | Loan Amount |
|---|---|---|---|
| Previous Owner | Mallinger Brandon A | $87,400 | |
| Previous Owner | Mallinger Brandon A | $77,569 |
Source: Public Records
Tax History Compared to Growth
Tax History
| Year | Tax Paid | Tax Assessment Tax Assessment Total Assessment is a certain percentage of the fair market value that is determined by local assessors to be the total taxable value of land and additions on the property. | Land | Improvement |
|---|---|---|---|---|
| 2024 | $2,305 | $44,010 | $10,990 | $33,020 |
| 2023 | $2,305 | $44,010 | $10,990 | $33,020 |
| 2022 | $1,762 | $27,140 | $6,960 | $20,180 |
| 2021 | $1,764 | $27,140 | $6,960 | $20,180 |
| 2020 | $1,759 | $27,140 | $6,960 | $20,180 |
| 2019 | $1,710 | $24,190 | $6,960 | $17,230 |
| 2018 | $1,754 | $24,190 | $6,960 | $17,230 |
| 2017 | $1,094 | $24,190 | $6,960 | $17,230 |
| 2016 | $1,036 | $23,110 | $6,960 | $16,150 |
| 2015 | $1,024 | $23,110 | $6,960 | $16,150 |
| 2014 | $1,024 | $23,110 | $6,960 | $16,150 |
| 2012 | -- | $23,530 | $6,960 | $16,570 |
Source: Public Records
Map
Nearby Homes
- 214 Marview Ave
- 365 Inverness Ave
- 314 N American Blvd
- 552 Tionda Dr N
- 0 Northwoods Blvd
- 92 Waller Ave
- 1015 van Arden Dr
- 113 Village Trail Dr Unit 6
- 113 Village Trail Dr Unit 2B
- 50 Clubhouse Way
- 2014 Waterfall Ln
- 2082 Waterfall Ln
- 2050 Old Falls Dr
- 2070 Settlers Trail Unit UN2070
- 2010 Settlers Trail
- 775 Cassel Creek Dr
- 106 Grosbeck St
- 416 Attica St
- 461 Poplar Grove Dr
- 545 Koch Ave
- 142 Westhafer Rd
- 134 Westhafer Rd
- 146 Westhafer Rd
- 131 Colebrook Dr
- 128 Westhafer Rd
- 125 Colebrook Dr
- 137 Colebrook Dr
- 143 Colebrook Dr
- 150 Westhafer Rd
- 119 Colebrook Dr
- 141 Westhafer Rd
- 122 Westhafer Rd
- 133 Westhafer Rd
- 145 Westhafer Rd
- 149 Colebrook Dr
- 149 Westhafer Rd
- 129 Westhafer Rd
- 154 Westhafer Rd
- 149 Westhafer Rd
- 111 Colebrook Dr