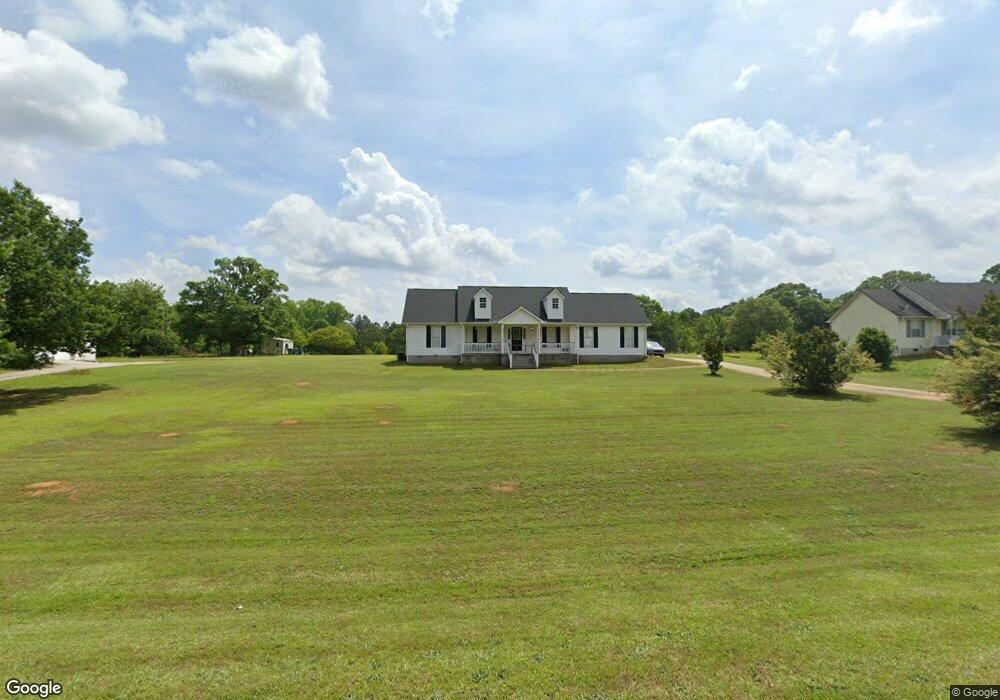
138 Wilder Way Williamson, GA 30292
Spalding County NeighborhoodEstimated Value: $237,000 - $304,000
--
Bed
2
Baths
1,444
Sq Ft
$185/Sq Ft
Est. Value
About This Home
This home is located at 138 Wilder Way, Williamson, GA 30292 and is currently estimated at $267,692, approximately $185 per square foot. 138 Wilder Way is a home located in Spalding County with nearby schools including Moreland Road Elementary School, Carver Road Middle School, and Griffin High School.
Ownership History
Date
Name
Owned For
Owner Type
Purchase Details
Closed on
Nov 20, 2020
Sold by
Jones Larry
Bought by
Burns Donald M and Burns Cynthia L
Current Estimated Value
Home Financials for this Owner
Home Financials are based on the most recent Mortgage that was taken out on this home.
Original Mortgage
$141,391
Outstanding Balance
$125,091
Interest Rate
2.8%
Mortgage Type
FHA
Estimated Equity
$142,601
Purchase Details
Closed on
Oct 1, 2020
Sold by
Jones Floyd L
Bought by
Jones Larry J
Home Financials for this Owner
Home Financials are based on the most recent Mortgage that was taken out on this home.
Original Mortgage
$141,391
Outstanding Balance
$125,091
Interest Rate
2.8%
Mortgage Type
FHA
Estimated Equity
$142,601
Purchase Details
Closed on
Jun 29, 2004
Sold by
Mers Inc
Bought by
Jones Larry and Jones Janice
Purchase Details
Closed on
May 4, 2004
Sold by
Etheridge Anthony and Etheridge Phyllis D
Bought by
Household Fin Corp
Purchase Details
Closed on
Mar 31, 2000
Sold by
Maddox Eugene
Bought by
Etheridge Anthony and Etheridge Phyllis
Home Financials for this Owner
Home Financials are based on the most recent Mortgage that was taken out on this home.
Original Mortgage
$91,200
Interest Rate
12.35%
Mortgage Type
New Conventional
Create a Home Valuation Report for This Property
The Home Valuation Report is an in-depth analysis detailing your home's value as well as a comparison with similar homes in the area
Home Values in the Area
Average Home Value in this Area
Purchase History
| Date | Buyer | Sale Price | Title Company |
|---|---|---|---|
| Burns Donald M | $144,000 | -- | |
| Jones Larry J | -- | -- | |
| Jones Larry J | -- | -- | |
| Jones Larry | $108,000 | -- | |
| Household Fin Corp | $100,531 | -- | |
| Etheridge Anthony | $114,000 | -- |
Source: Public Records
Mortgage History
| Date | Status | Borrower | Loan Amount |
|---|---|---|---|
| Open | Burns Donald M | $141,391 | |
| Previous Owner | Etheridge Anthony | $91,200 |
Source: Public Records
Tax History Compared to Growth
Tax History
| Year | Tax Paid | Tax Assessment Tax Assessment Total Assessment is a certain percentage of the fair market value that is determined by local assessors to be the total taxable value of land and additions on the property. | Land | Improvement |
|---|---|---|---|---|
| 2024 | $3,135 | $92,752 | $10,000 | $82,752 |
| 2023 | $3,290 | $87,073 | $10,000 | $77,073 |
| 2022 | $2,596 | $72,204 | $8,000 | $64,204 |
| 2021 | $2,016 | $56,244 | $4,000 | $52,244 |
| 2020 | $1,689 | $45,283 | $4,000 | $41,283 |
| 2019 | $1,588 | $41,670 | $4,000 | $37,670 |
| 2018 | $0 | $38,307 | $4,000 | $34,307 |
| 2017 | $1,460 | $38,307 | $4,000 | $34,307 |
| 2016 | $1,113 | $28,438 | $4,000 | $24,438 |
| 2015 | $1,392 | $34,788 | $8,000 | $26,788 |
| 2014 | $1,419 | $34,788 | $8,000 | $26,788 |
Source: Public Records
Map
Nearby Homes
- 121 Wilder Way
- 158 Merrybrook Rd
- 2650 Williamson Rd
- 2640 Williamson Rd
- 474 N Rover Rd
- 2630 Williamson Rd
- 120 Delray Cir Unit 2
- 2620 Williamson Rd
- 502 N Rover Rd
- 90 & 212 Kendall Dr
- 235 Kendall Dr
- 243 Kendall Dr
- 1729 Mary Ave
- 0 Georgia 362 Unit 10581280
- 0 Georgia 362 Unit 10634213
- 61 Bartlett Dr
- 3465 Newnan Rd
- 1741 Park Ln
- 0 Newnan Rd Unit 10550410
- 1648 Williamson Rd
- 136 Wilder Way
- 140 Wilder Way
- 134 Wilder Way
- 142 Wilder Way
- 137 Wilder Way
- 135 Wilder Way
- 139 Wilder Way
- 141 Wilder Way
- 133 Wilder Way
- 132 Wilder Way
- 144 Wilder Way
- 131 Wilder Way
- 143 Wilder Way
- 128 Wilder Way Unit 22
- 146 Wilder Way
- 129 Wilder Way
- 118 Wilder Way
- 1697 Rover Zetella Rd
- 124 Wilder Way
- 1691-B Rover Zetella Rd