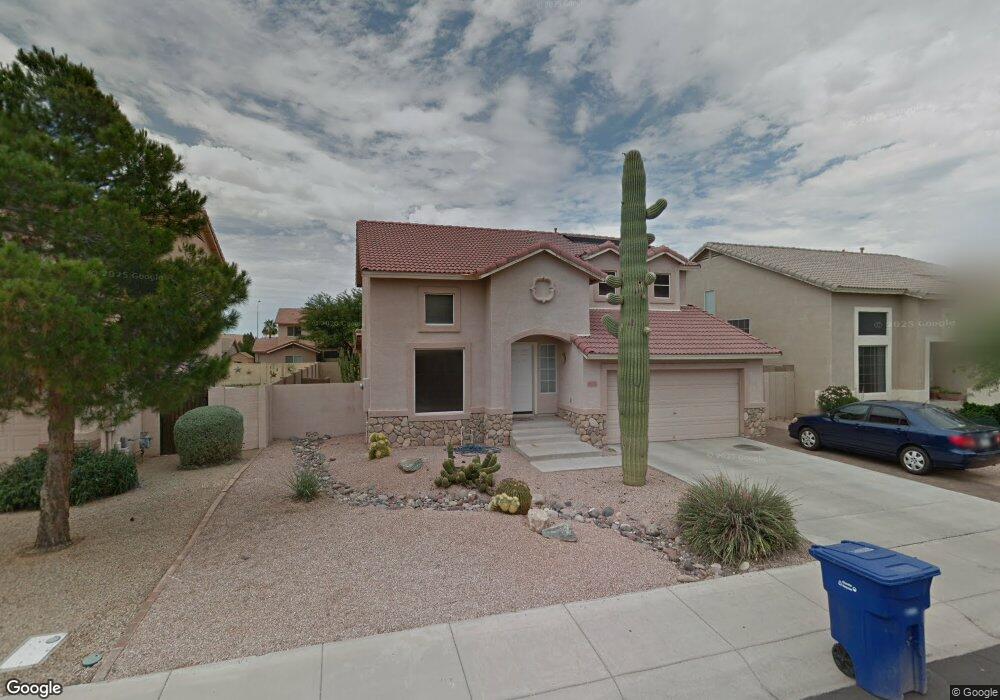
1380 E Flint St Chandler, AZ 85225
East Chandler NeighborhoodEstimated Value: $468,347 - $554,000
4
Beds
3
Baths
1,880
Sq Ft
$278/Sq Ft
Est. Value
About This Home
This home is located at 1380 E Flint St, Chandler, AZ 85225 and is currently estimated at $521,837, approximately $277 per square foot. 1380 E Flint St is a home located in Maricopa County with nearby schools including Sanborn Elementary School, Willis Junior High School, and Chandler High School.
Ownership History
Date
Name
Owned For
Owner Type
Purchase Details
Closed on
Apr 27, 2004
Sold by
Brown Thomas R and Brown Pamela R
Bought by
Powe Brennan S and Powe Stacy
Current Estimated Value
Home Financials for this Owner
Home Financials are based on the most recent Mortgage that was taken out on this home.
Original Mortgage
$164,000
Interest Rate
5.99%
Mortgage Type
New Conventional
Purchase Details
Closed on
Sep 17, 1996
Sold by
Greystone Homes Inc
Bought by
Brown Thomas R and Brown Pamela R
Home Financials for this Owner
Home Financials are based on the most recent Mortgage that was taken out on this home.
Original Mortgage
$122,700
Interest Rate
7.87%
Mortgage Type
FHA
Create a Home Valuation Report for This Property
The Home Valuation Report is an in-depth analysis detailing your home's value as well as a comparison with similar homes in the area
Home Values in the Area
Average Home Value in this Area
Purchase History
| Date | Buyer | Sale Price | Title Company |
|---|---|---|---|
| Powe Brennan S | $205,000 | First American Title Ins Co | |
| Brown Thomas R | $129,205 | First American Title |
Source: Public Records
Mortgage History
| Date | Status | Borrower | Loan Amount |
|---|---|---|---|
| Previous Owner | Powe Brennan S | $164,000 | |
| Previous Owner | Brown Thomas R | $122,700 | |
| Closed | Powe Brennan S | $41,000 |
Source: Public Records
Tax History
| Year | Tax Paid | Tax Assessment Tax Assessment Total Assessment is a certain percentage of the fair market value that is determined by local assessors to be the total taxable value of land and additions on the property. | Land | Improvement |
|---|---|---|---|---|
| 2025 | $1,858 | $23,856 | -- | -- |
| 2024 | $1,795 | $22,720 | -- | -- |
| 2023 | $1,795 | $37,320 | $7,460 | $29,860 |
| 2022 | $1,732 | $27,750 | $5,550 | $22,200 |
| 2021 | $1,815 | $26,200 | $5,240 | $20,960 |
| 2020 | $1,807 | $24,630 | $4,920 | $19,710 |
| 2019 | $1,738 | $22,960 | $4,590 | $18,370 |
| 2018 | $1,683 | $21,360 | $4,270 | $17,090 |
| 2017 | $1,569 | $19,950 | $3,990 | $15,960 |
| 2016 | $1,511 | $19,250 | $3,850 | $15,400 |
| 2015 | $1,464 | $19,250 | $3,850 | $15,400 |
Source: Public Records
Map
Nearby Homes
- 321 N Senate St
- 414 N Hudson Place
- 420 N Leoma Ln
- 421 N Leoma Ln Unit 4
- 1182 E Erie St
- 1075 E Chandler Blvd Unit 119
- 155 N Brookside St
- 510 N Jesse Ct
- 155 N Lakeview Blvd Unit 208
- 240 N Monte Vista St
- 1771 E Tulsa St
- 1695 E Monterey St
- 874 E Tyson St
- 24 S Willow Creek St
- 1416 E Chicago Cir
- 1270 E Chicago Cir
- 1871 E Buffalo St
- 857 E Buffalo St
- 1948 E Carla Vista Dr
- 1462 E Cindy St
- 1370 E Flint St
- 1390 E Flint St
- 1360 E Flint St
- 1400 E Flint St
- 1371 E Erie St
- 1381 E Erie St
- 1361 E Erie St
- 1391 E Erie St
- 314 N Nantucket St
- 1379 E Flint St
- 1369 E Flint St
- 1410 E Flint St
- 1350 E Flint St
- 1351 E Erie St
- 1401 E Erie St
- 308 N Nantucket St
- 1359 E Flint St
- 306 N Nantucket St
- 1340 E Flint St
- 1420 E Flint St
Your Personal Tour Guide
Ask me questions while you tour the home.