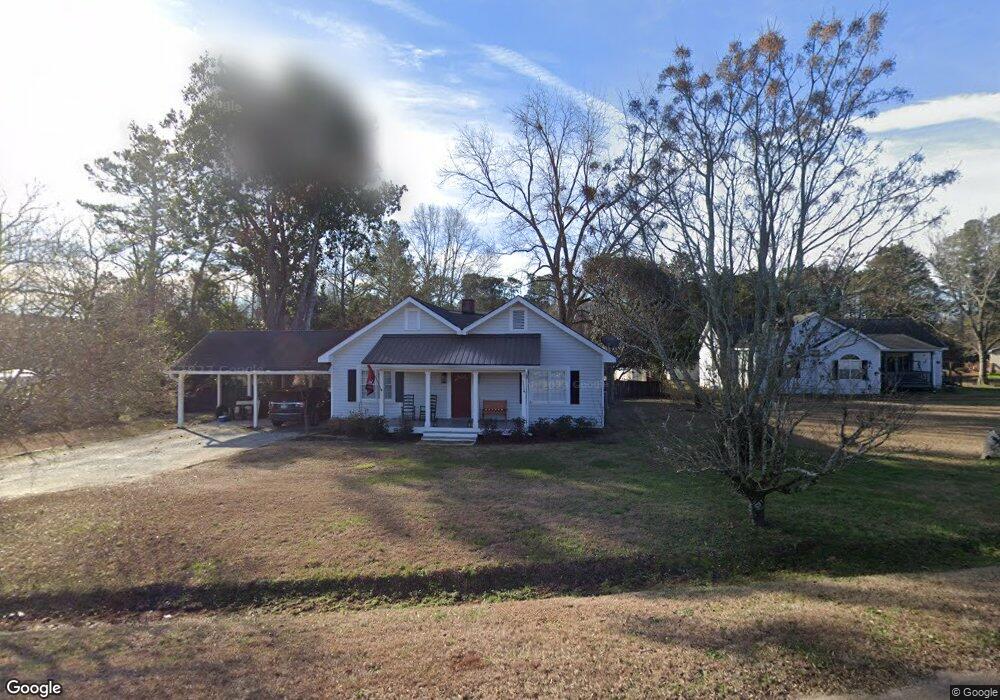
1380 Mchenry Crossing Madison, GA 30650
Estimated Value: $327,532 - $902,000
3
Beds
2
Baths
2,078
Sq Ft
$239/Sq Ft
Est. Value
About This Home
This home is located at 1380 Mchenry Crossing, Madison, GA 30650 and is currently estimated at $497,633, approximately $239 per square foot. 1380 Mchenry Crossing is a home located in Morgan County with nearby schools including Morgan County Primary School, Morgan County Elementary School, and Morgan County Middle School.
Ownership History
Date
Name
Owned For
Owner Type
Purchase Details
Closed on
Apr 21, 2015
Sold by
Miller Kathleen Wallace
Bought by
Fairview Real Estate Svcs Llc
Current Estimated Value
Purchase Details
Closed on
Apr 20, 2012
Sold by
Fairview Real Estate Svcs
Bought by
Miller Kathleen W and Miller William D
Home Financials for this Owner
Home Financials are based on the most recent Mortgage that was taken out on this home.
Original Mortgage
$70,000
Interest Rate
4.13%
Mortgage Type
New Conventional
Purchase Details
Closed on
Dec 12, 2007
Sold by
Miller Kathleen W
Bought by
Fairview Real Estate Svcs Llc
Purchase Details
Closed on
Dec 13, 2002
Sold by
Gillis Grady E-Barry
Bought by
Miller Kathleen W
Purchase Details
Closed on
Feb 16, 1999
Sold by
Gill Grady
Bought by
Gillis Grady E-Barry
Purchase Details
Closed on
Dec 8, 1995
Sold by
Wood Brian H and Wood Lisa S
Bought by
Gillis Grady E
Create a Home Valuation Report for This Property
The Home Valuation Report is an in-depth analysis detailing your home's value as well as a comparison with similar homes in the area
Home Values in the Area
Average Home Value in this Area
Purchase History
| Date | Buyer | Sale Price | Title Company |
|---|---|---|---|
| Fairview Real Estate Svcs Llc | -- | -- | |
| Miller Kathleen W | -- | -- | |
| Fairview Real Estate Svcs Llc | -- | -- | |
| Miller Kathleen W | -- | -- | |
| Miller Kathleen W | $92,500 | -- | |
| Gillis Grady E-Barry | -- | -- | |
| Gillis Grady E | $66,000 | -- |
Source: Public Records
Mortgage History
| Date | Status | Borrower | Loan Amount |
|---|---|---|---|
| Previous Owner | Miller Kathleen W | $70,000 |
Source: Public Records
Tax History Compared to Growth
Tax History
| Year | Tax Paid | Tax Assessment Tax Assessment Total Assessment is a certain percentage of the fair market value that is determined by local assessors to be the total taxable value of land and additions on the property. | Land | Improvement |
|---|---|---|---|---|
| 2024 | $1,705 | $74,840 | $8,240 | $66,600 |
| 2023 | $1,588 | $67,568 | $8,000 | $59,568 |
| 2022 | $1,495 | $61,106 | $4,800 | $56,306 |
| 2021 | $1,481 | $60,306 | $4,000 | $56,306 |
| 2020 | $1,419 | $57,223 | $4,000 | $53,223 |
| 2019 | $1,436 | $56,998 | $4,000 | $52,998 |
| 2018 | $1,446 | $56,567 | $4,000 | $52,567 |
| 2017 | $1,223 | $47,200 | $3,600 | $43,600 |
| 2016 | $1,249 | $47,200 | $3,600 | $43,600 |
| 2015 | $1,075 | $47,200 | $3,600 | $43,600 |
| 2014 | -- | $41,316 | $3,600 | $37,716 |
| 2013 | -- | $31,152 | $3,600 | $27,552 |
Source: Public Records
Map
Nearby Homes
- 1191 Wildflower Way
- 1071 Wildflower Way
- 1050 Eugene Ln
- 0 Double Bridges Rd Unit 7579574
- 0 Double Bridges Rd Unit 1023783
- 0 Double Bridges Rd Unit 67935
- 0 Double Bridges Rd Unit 10460793
- 1080 Brownwood Rd
- 1190 Dixie Hwy
- 1113 Cornwall Dr
- 991 Old Post Rd
- 724 Hill St
- 546 Fourth St
- 1200 Mcnair Ln
- 617 Dixie Ave
- 665 E Walton St
- 411 Old Post Rd
- 691 Skyline Dr
- 0 Apalachee Ridge Unit 23270055
- 0 Apalachee Ridge Unit 23542402
- 1370 Mchenry Crossing
- 1390 Mchenry Crossing
- 1360 Mchenry Crossing
- 1420 Mchenry Crossing
- 1441 Mchenry Crossing
- 1320 Mchenry Crossing
- 1311 Mchenry Crossing
- 1353 Mchenry Crossing
- 2010 Dixie Hwy
- 1451 Mchenry Crossing
- 2060 Dixie Hwy
- 2030 Dixie Hwy
- 1401 Mchenry Crossing
- 1421 Mchenry Crossing
- 000 Mchenry Crossing
- 2000 Dixie Hwy
- 1930 Dixie Hwy
- 1930 Dixie Hwy Unit Tract 2
- 1240 Mchenry Crossing
- 1030 Wildflower Way