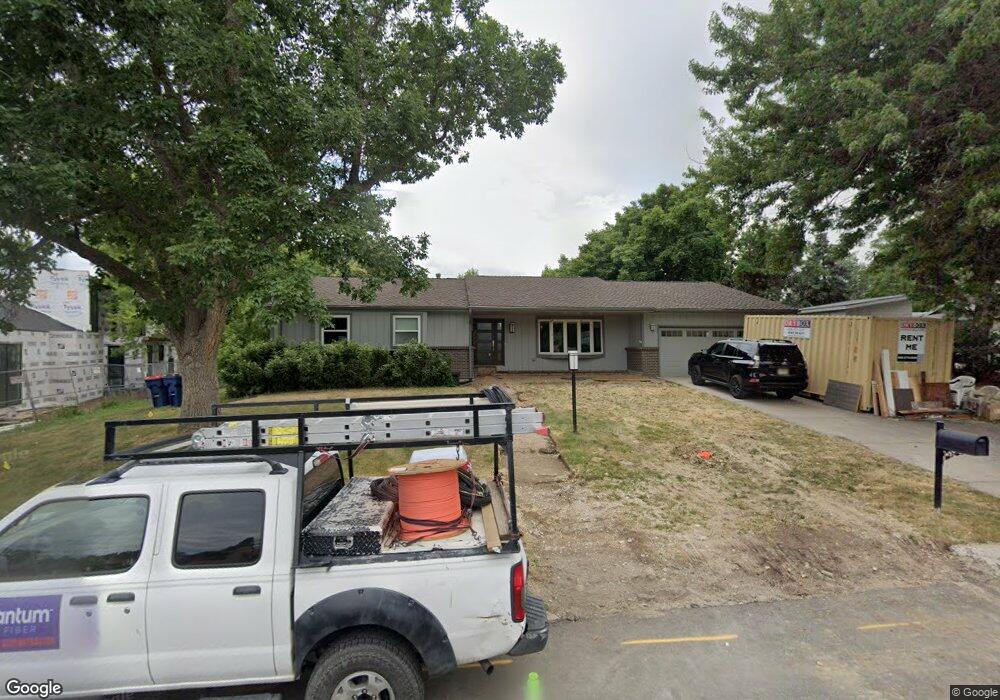
13800 Crabapple Rd Golden, CO 80401
Applewood West NeighborhoodEstimated Value: $1,081,000 - $1,656,000
5
Beds
3
Baths
3,404
Sq Ft
$383/Sq Ft
Est. Value
About This Home
This home is located at 13800 Crabapple Rd, Golden, CO 80401 and is currently estimated at $1,304,652, approximately $383 per square foot. 13800 Crabapple Rd is a home located in Jefferson County with nearby schools including Maple Grove Elementary School, Bell Middle School, and Everitt Middle School.
Ownership History
Date
Name
Owned For
Owner Type
Purchase Details
Closed on
Sep 19, 2025
Sold by
Ott Kevin L and Ott Elizabeth D
Bought by
Ott Family Trust
Current Estimated Value
Purchase Details
Closed on
Oct 8, 2019
Sold by
Ott Kevin L
Bought by
Ott Kevin L and Ott Elizabeth D
Purchase Details
Closed on
Jun 13, 2018
Sold by
Haag Charles
Bought by
Ott Kevin L
Home Financials for this Owner
Home Financials are based on the most recent Mortgage that was taken out on this home.
Original Mortgage
$510,000
Interest Rate
4.5%
Mortgage Type
New Conventional
Purchase Details
Closed on
Apr 12, 2018
Sold by
Mcneil Francis E
Bought by
Haag Charles
Home Financials for this Owner
Home Financials are based on the most recent Mortgage that was taken out on this home.
Original Mortgage
$596,200
Interest Rate
4.43%
Mortgage Type
Construction
Create a Home Valuation Report for This Property
The Home Valuation Report is an in-depth analysis detailing your home's value as well as a comparison with similar homes in the area
Home Values in the Area
Average Home Value in this Area
Purchase History
| Date | Buyer | Sale Price | Title Company |
|---|---|---|---|
| Ott Family Trust | -- | None Listed On Document | |
| Ott Kevin L | -- | Heritage Title Company | |
| Ott Kevin L | $700,000 | First American Title | |
| Haag Charles | $620,000 | First American Title |
Source: Public Records
Mortgage History
| Date | Status | Borrower | Loan Amount |
|---|---|---|---|
| Previous Owner | Ott Kevin L | $510,000 | |
| Previous Owner | Haag Charles | $596,200 |
Source: Public Records
Tax History
| Year | Tax Paid | Tax Assessment Tax Assessment Total Assessment is a certain percentage of the fair market value that is determined by local assessors to be the total taxable value of land and additions on the property. | Land | Improvement |
|---|---|---|---|---|
| 2024 | $6,033 | $62,114 | $29,053 | $33,061 |
| 2023 | $6,033 | $62,114 | $29,053 | $33,061 |
| 2022 | $4,714 | $47,424 | $18,395 | $29,029 |
| 2021 | $4,778 | $48,788 | $18,924 | $29,864 |
| 2020 | $4,503 | $46,029 | $15,577 | $30,452 |
| 2019 | $4,444 | $46,029 | $15,577 | $30,452 |
| 2018 | $3,693 | $44,087 | $14,575 | $29,512 |
| 2017 | $3,366 | $44,087 | $14,575 | $29,512 |
| 2016 | $3,220 | $41,090 | $11,741 | $29,349 |
| 2015 | $2,577 | $41,090 | $11,741 | $29,349 |
| 2014 | $2,577 | $33,734 | $10,746 | $22,988 |
Source: Public Records
Map
Nearby Homes
- 13572 W 24th Place
- 14220 Berry Rd
- 13700 W 30th Place
- 3100 Braun Ct
- 14280 W 30th Ave
- 14100 Foothill Cir
- 3095 Crabapple Rd
- 2990 Alkire St
- 13028 W 27th Ln
- 3210 Arbutus St
- 2127 Elderberry Rd
- 2095 Elderberry Rd
- 14509 W 32nd Ave
- 12755 W 23rd Ave
- 12993 W 20th Ave Unit B12993
- 2180 Myrtlewood Ln
- 2145 Myrtlewood Ln
- 2148 Applewood Dr
- 1971 Yank Ct
- 2110 Applewood Dr
- 13780 Crabapple Rd
- 13810 Crabapple Rd
- 13815 W 26th Ave
- 13785 W 26th Ave
- 2700 Clover Rd
- 13710 Crabapple Rd
- 2705 Clover Rd
- 13880 Crabapple Rd
- 13715 W 26th Ave
- 13885 W 26th Ave
- 2705 Crabapple Rd
- 13378 W 25th Place
- 2740 Clover Rd
- 2735 Clover Rd
- 13800 W 26th Ave
- 13700 Crabapple Rd
- 2700 Deframe Rd
- 13705 W 26th Ave
- 13820 W 26th Ave
- 2725 Crabapple Rd
Your Personal Tour Guide
Ask me questions while you tour the home.