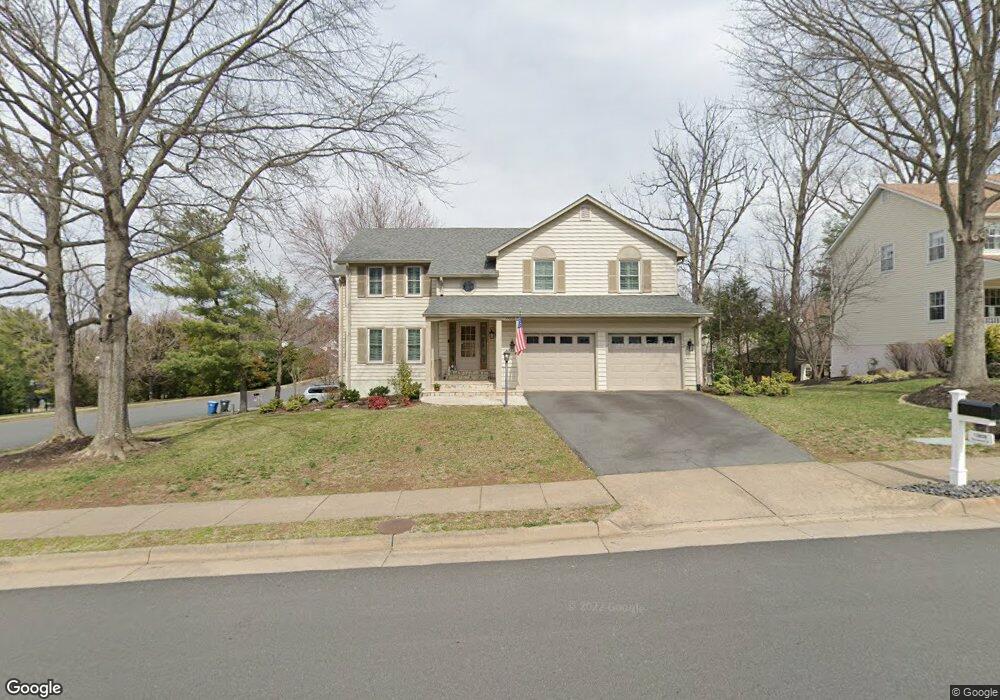
13808 Stonefield Dr Clifton, VA 20124
Estimated Value: $924,136 - $977,000
5
Beds
4
Baths
2,406
Sq Ft
$394/Sq Ft
Est. Value
About This Home
This home is located at 13808 Stonefield Dr, Clifton, VA 20124 and is currently estimated at $949,034, approximately $394 per square foot. 13808 Stonefield Dr is a home located in Fairfax County with nearby schools including Liberty Middle School, Centreville High School, and St. Andrew the Apostle School.
Ownership History
Date
Name
Owned For
Owner Type
Purchase Details
Closed on
Jun 10, 2019
Sold by
Jeffers Devlin John Martin and Jeffers Devlin Patricia
Bought by
Devlin John M and Devlin Patricia J
Current Estimated Value
Purchase Details
Closed on
Jul 15, 2015
Sold by
Esenbock Stephen D
Bought by
Devlin John M
Home Financials for this Owner
Home Financials are based on the most recent Mortgage that was taken out on this home.
Original Mortgage
$340,000
Outstanding Balance
$265,297
Interest Rate
3.88%
Mortgage Type
New Conventional
Estimated Equity
$683,737
Purchase Details
Closed on
Jul 22, 1996
Sold by
Wojtasek James D
Bought by
Esenbock Stephen D
Home Financials for this Owner
Home Financials are based on the most recent Mortgage that was taken out on this home.
Original Mortgage
$223,200
Interest Rate
8.28%
Create a Home Valuation Report for This Property
The Home Valuation Report is an in-depth analysis detailing your home's value as well as a comparison with similar homes in the area
Home Values in the Area
Average Home Value in this Area
Purchase History
| Date | Buyer | Sale Price | Title Company |
|---|---|---|---|
| Devlin John M | -- | None Available | |
| Devlin John M | $555,000 | -- | |
| Esenbock Stephen D | $248,000 | -- |
Source: Public Records
Mortgage History
| Date | Status | Borrower | Loan Amount |
|---|---|---|---|
| Open | Devlin John M | $340,000 | |
| Previous Owner | Esenbock Stephen D | $223,200 |
Source: Public Records
Tax History Compared to Growth
Tax History
| Year | Tax Paid | Tax Assessment Tax Assessment Total Assessment is a certain percentage of the fair market value that is determined by local assessors to be the total taxable value of land and additions on the property. | Land | Improvement |
|---|---|---|---|---|
| 2025 | $9,140 | $844,370 | $300,000 | $544,370 |
| 2024 | $9,140 | $788,910 | $280,000 | $508,910 |
| 2023 | $8,964 | $794,320 | $280,000 | $514,320 |
| 2022 | $8,202 | $717,310 | $250,000 | $467,310 |
| 2021 | $7,409 | $631,380 | $220,000 | $411,380 |
| 2020 | $7,231 | $610,980 | $210,000 | $400,980 |
| 2019 | $6,939 | $586,320 | $210,000 | $376,320 |
| 2018 | $6,708 | $583,320 | $207,000 | $376,320 |
| 2017 | $6,640 | $571,940 | $203,000 | $368,940 |
| 2016 | $6,496 | $560,710 | $199,000 | $361,710 |
| 2015 | $6,449 | $577,900 | $205,000 | $372,900 |
| 2014 | $6,149 | $552,190 | $195,000 | $357,190 |
Source: Public Records
Map
Nearby Homes
- 13813 Foggy Hills Ct
- 13910 Stonefield Ln
- 6218 Stonehunt Place
- 14159 Autumn Cir
- 13633 Union Village Cir
- 14102 Autumn Cir
- 6605 English Saddle Ct
- 6309 Trevilian Place
- 6488 Palisades Dr
- 6117 Mountain Springs Ln
- 13943 Preacher Chapman Place
- 13209 Johnny Moore Ln
- 6311 Betsy Ross Ct
- 14079 Red River Dr
- 13875 Laura Ratcliff Ct
- 14005C Grumble Jones Ct
- 13906 Big Yankee Ln
- 14146 Red River Dr
- 14000 Grumble Jones Ct Unit B
- 6789 Stone Maple Terrace
- 13804 Stonefield Dr
- 6511 Stonedale Ln
- 13707 Stonedale Ct
- 13807 Stonefield Dr
- 13809 Stonefield Dr
- 13805 Stonefield Dr
- 13802 Stonefield Dr
- 13901 Stonefield Dr
- 13705 Stonedale Ct
- 13710 Stonedale Ct
- 13803 Stonefield Dr
- 13903 Stonefield Dr
- 13900 Stonefield Ln
- 6630 Rockland Dr
- 6632 Rockland Dr
- 13708 Stonedale Ct
- 6618 Rockland Dr
- 13701 Stonedale Ct
- 6628 Rockland Dr
- 6620 Rockland Dr