Estimated Value: $352,658 - $392,000
3
Beds
3
Baths
1,759
Sq Ft
$210/Sq Ft
Est. Value
About This Home
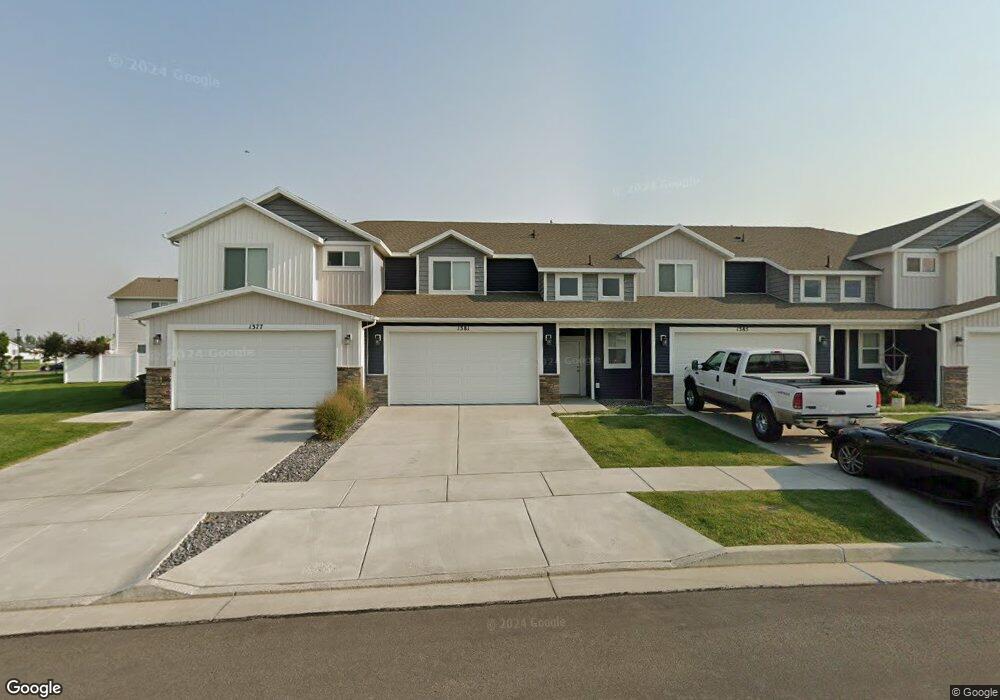
This home is located at 1381 E 380 S, Hyrum, UT 84319 and is currently estimated at $369,415, approximately $210 per square foot. 1381 E 380 S is a home located in Cache County with nearby schools including Canyon School, South Cache Middle School, and Mountain Crest High School.
Ownership History
Date
Name
Owned For
Owner Type
Purchase Details
Closed on
Oct 20, 2021
Sold by
Faerber Preston
Bought by
Faerber Preston and Faerber Megan
Current Estimated Value
Home Financials for this Owner
Home Financials are based on the most recent Mortgage that was taken out on this home.
Original Mortgage
$250,000
Outstanding Balance
$228,183
Interest Rate
3.01%
Mortgage Type
New Conventional
Estimated Equity
$141,232
Purchase Details
Closed on
Mar 13, 2019
Sold by
Kartchner Homes Cv Division Inc
Bought by
Faerber Preston
Home Financials for this Owner
Home Financials are based on the most recent Mortgage that was taken out on this home.
Original Mortgage
$214,545
Interest Rate
4.4%
Mortgage Type
New Conventional
Purchase Details
Closed on
Mar 15, 2018
Sold by
Kartchner Land Mgmt
Bought by
Kartchner Home Cv Division
Create a Home Valuation Report for This Property
The Home Valuation Report is an in-depth analysis detailing your home's value as well as a comparison with similar homes in the area
Home Values in the Area
Average Home Value in this Area
Purchase History
| Date | Buyer | Sale Price | Title Company |
|---|---|---|---|
| Faerber Preston | -- | Boston National Ttl Agcy Llc | |
| Faerber Preston | -- | Inwest Title Services Inc | |
| Kartchner Home Cv Division | -- | -- |
Source: Public Records
Mortgage History
| Date | Status | Borrower | Loan Amount |
|---|---|---|---|
| Open | Faerber Preston | $250,000 | |
| Closed | Faerber Preston | $214,545 |
Source: Public Records
Tax History
| Year | Tax Paid | Tax Assessment Tax Assessment Total Assessment is a certain percentage of the fair market value that is determined by local assessors to be the total taxable value of land and additions on the property. | Land | Improvement |
|---|---|---|---|---|
| 2025 | $1,314 | $188,685 | $0 | $0 |
| 2024 | $1,434 | $192,325 | $0 | $0 |
| 2023 | $1,572 | $201,575 | $0 | $0 |
| 2022 | $153 | $187,825 | $0 | $0 |
| 2021 | $1,294 | $244,900 | $55,000 | $189,900 |
| 2020 | $1,208 | $214,600 | $55,000 | $159,600 |
| 2019 | $1,243 | $207,600 | $48,000 | $159,600 |
| 2018 | $540 | $48,000 | $48,000 | $0 |
Source: Public Records
Map
Nearby Homes
- 1377 E 380 S
- 1385 E 380 S
- 1389 E 380 S
- 1378 E 340 S Unit 39
- 1382 E 340 S Unit 38
- 1374 E 340 S Unit 40
- 1392 E 340 S Unit 37
- 1392 E 340 S
- 1370 E 340 S Unit 41
- 1399 E 380 S
- 1396 E 340 S Unit 36
- 1400 E 340 S
- 1400 E 340 S Unit 35
- 1403 E 380 S
- 1388 E 380 S
- 1404 E 340 S
- 1407 E 380 S
- 1392 E 380 S
- 376 S 1320 E Unit 171
- 1396 E 380 S
Your Personal Tour Guide
Ask me questions while you tour the home.