Estimated Value: $507,814 - $571,000
3
Beds
7
Baths
1,605
Sq Ft
$328/Sq Ft
Est. Value
About This Home
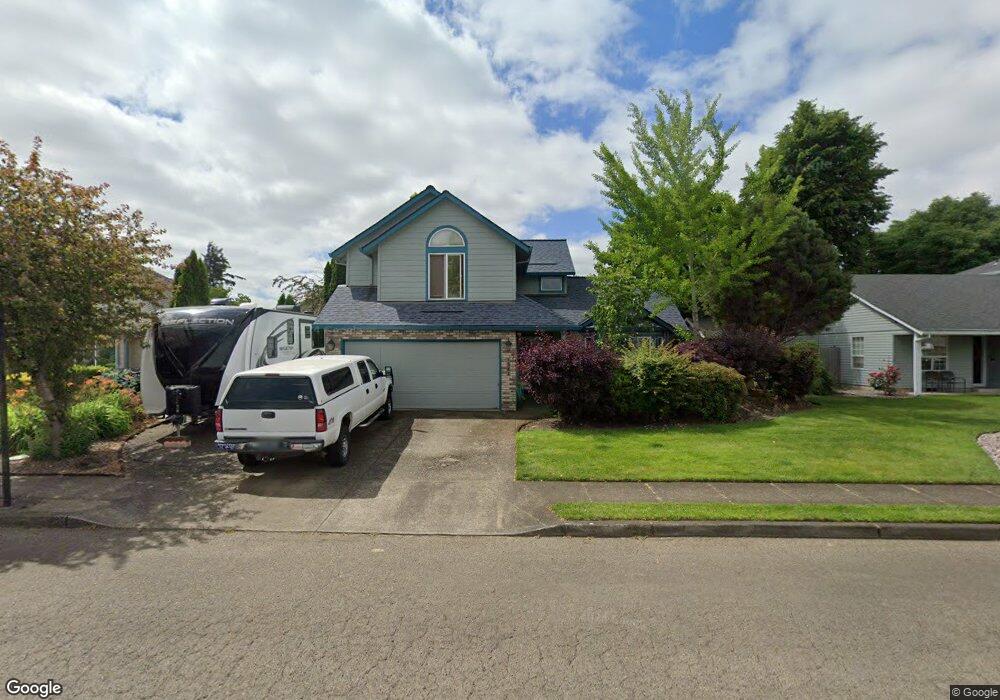
This home is located at 1381 SE 12th Loop, Canby, OR 97013 and is currently estimated at $526,704, approximately $328 per square foot. 1381 SE 12th Loop is a home located in Clackamas County with nearby schools including Cecile Trost Elementary School, Carus School, and Baker Prairie Middle School.
Ownership History
Date
Name
Owned For
Owner Type
Purchase Details
Closed on
Jan 20, 2012
Sold by
Keefe Alvin L
Bought by
Keefe Alvin L and Keefe Diana L
Current Estimated Value
Home Financials for this Owner
Home Financials are based on the most recent Mortgage that was taken out on this home.
Original Mortgage
$113,000
Outstanding Balance
$9,773
Interest Rate
3.93%
Mortgage Type
New Conventional
Estimated Equity
$516,931
Purchase Details
Closed on
Feb 20, 2001
Sold by
Selman John M
Bought by
Keefe Alvin L
Home Financials for this Owner
Home Financials are based on the most recent Mortgage that was taken out on this home.
Original Mortgage
$87,600
Interest Rate
6.89%
Purchase Details
Closed on
Feb 9, 2000
Sold by
Bolsinger A Scot and Bolsinger Sandra
Bought by
Selman John M
Purchase Details
Closed on
Feb 4, 2000
Sold by
Nahmias Jack and Nahmias Joanne
Bought by
Bolsinger A Scot and Bolsinger Sandra
Purchase Details
Closed on
Jul 6, 1995
Sold by
Nahmias Jack and Nahmias Joanne
Bought by
Nahmias Jack and Nahmias Joanne
Create a Home Valuation Report for This Property
The Home Valuation Report is an in-depth analysis detailing your home's value as well as a comparison with similar homes in the area
Home Values in the Area
Average Home Value in this Area
Purchase History
| Date | Buyer | Sale Price | Title Company |
|---|---|---|---|
| Keefe Alvin L | -- | Wfg Title | |
| Keefe Alvin L | $167,500 | First American Title Ins Co | |
| Selman John M | $154,500 | Pacific Nw Title | |
| Bolsinger A Scot | -- | Pacific Nw Title | |
| Nahmias Jack | -- | -- |
Source: Public Records
Mortgage History
| Date | Status | Borrower | Loan Amount |
|---|---|---|---|
| Open | Keefe Alvin L | $113,000 | |
| Closed | Keefe Alvin L | $87,600 |
Source: Public Records
Tax History
| Year | Tax Paid | Tax Assessment Tax Assessment Total Assessment is a certain percentage of the fair market value that is determined by local assessors to be the total taxable value of land and additions on the property. | Land | Improvement |
|---|---|---|---|---|
| 2025 | $5,039 | $284,407 | -- | -- |
| 2024 | $4,898 | $276,124 | -- | -- |
| 2023 | $4,898 | $268,082 | -- | -- |
| 2022 | $4,505 | $260,274 | $0 | $0 |
| 2021 | $4,338 | $252,694 | $0 | $0 |
| 2020 | $4,260 | $245,334 | $0 | $0 |
| 2019 | $4,057 | $238,189 | $0 | $0 |
| 2018 | $3,966 | $231,251 | $0 | $0 |
| 2017 | $3,866 | $224,516 | $0 | $0 |
| 2016 | $3,737 | $217,977 | $0 | $0 |
| 2015 | $3,609 | $211,628 | $0 | $0 |
| 2014 | $3,505 | $205,464 | $0 | $0 |
Source: Public Records
Map
Nearby Homes
- 1804 S Locust St
- 1380 SE 9th Ave
- 1460 SE 9th Ave
- 1316 SE 16th Ave
- 1407 SE 7th Ave
- 1827 S Pepperwood St
- 1821 S Pepperwood St
- 1825 S Pepperwood St
- 1823 S Pepperwood St
- 312 SE 13th Place
- 1650 S Redwood St
- 331 SE 9th Ave
- 1305 SE 17th Ave
- 423 SE 7th Ave
- 1231 SE 18th Place
- 1053 S Vine St
- 1608 S Fern Way
- 203 SE 16th Ave
- 201 SE 16th Ave
- 357 SE 7th Ave
- 1369 SE 12th Loop
- 1423 SE 12th Loop
- 1374 SE 12th Loop
- 1416 SE 12th Loop
- 1392 SE 12th Loop
- 1345 SE 12th Loop
- 1370 SE 12th Loop
- 1211 S Redwood St
- 1434 SE 12th Loop
- 1356 SE 12 Lp (No Calls)
- 1356 SE 12th Loop
- 1440 SE 12th Loop
- 1460 SE 12th Loop
- 1327 SE 12th Loop
- 1338 SE 12th Loop
- 1330 SE 12th Loop
- 1387 SE 11th Loop
- 1385 SE 12th Loop
- 1379 SE 11th Loop
- 1377 SE 12th Loop
Your Personal Tour Guide
Ask me questions while you tour the home.