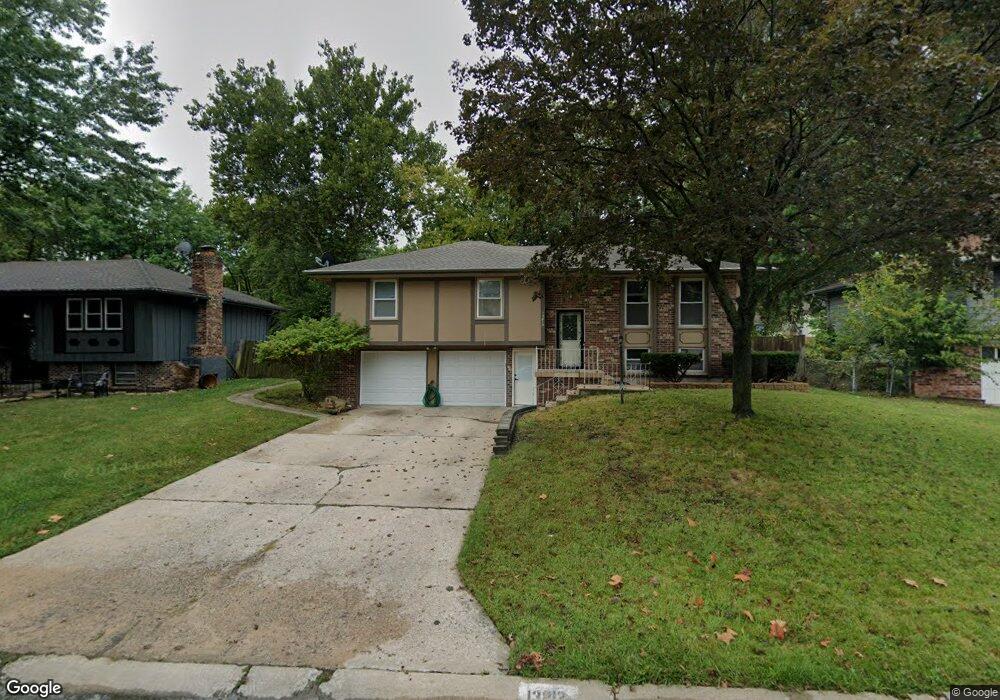
13812 Bennington Ave Grandview, MO 64030
Estimated Value: $208,000 - $242,000
3
Beds
3
Baths
1,152
Sq Ft
$194/Sq Ft
Est. Value
About This Home
This home is located at 13812 Bennington Ave, Grandview, MO 64030 and is currently estimated at $223,768, approximately $194 per square foot. 13812 Bennington Ave is a home located in Jackson County with nearby schools including Meadowmere Elementary School, Grandview Middle, and Grandview High School.
Ownership History
Date
Name
Owned For
Owner Type
Purchase Details
Closed on
Dec 3, 2009
Sold by
Deutsche Bank National Trust Company
Bought by
Torres Jesus
Current Estimated Value
Home Financials for this Owner
Home Financials are based on the most recent Mortgage that was taken out on this home.
Original Mortgage
$76,050
Outstanding Balance
$49,426
Interest Rate
4.83%
Mortgage Type
Future Advance Clause Open End Mortgage
Estimated Equity
$174,342
Purchase Details
Closed on
Aug 24, 2009
Sold by
Little Bey David
Bought by
Deutsche Bank National Trust Company
Purchase Details
Closed on
Jul 20, 2006
Sold by
Winningham Richard A and Winningham Laura E
Bought by
Little Bey David
Home Financials for this Owner
Home Financials are based on the most recent Mortgage that was taken out on this home.
Original Mortgage
$135,000
Interest Rate
11.8%
Mortgage Type
Purchase Money Mortgage
Create a Home Valuation Report for This Property
The Home Valuation Report is an in-depth analysis detailing your home's value as well as a comparison with similar homes in the area
Home Values in the Area
Average Home Value in this Area
Purchase History
| Date | Buyer | Sale Price | Title Company |
|---|---|---|---|
| Torres Jesus | -- | Mokan Title Services Llc | |
| Deutsche Bank National Trust Company | $65,625 | Assured Quality Title Co | |
| Little Bey David | -- | Accurate Title Company Llc |
Source: Public Records
Mortgage History
| Date | Status | Borrower | Loan Amount |
|---|---|---|---|
| Open | Torres Jesus | $76,050 | |
| Previous Owner | Little Bey David | $135,000 |
Source: Public Records
Tax History
| Year | Tax Paid | Tax Assessment Tax Assessment Total Assessment is a certain percentage of the fair market value that is determined by local assessors to be the total taxable value of land and additions on the property. | Land | Improvement |
|---|---|---|---|---|
| 2025 | $1,766 | $24,974 | $8,877 | $16,097 |
| 2024 | $1,736 | $21,717 | $2,820 | $18,897 |
| 2023 | $1,736 | $21,717 | $2,947 | $18,770 |
| 2022 | $1,778 | $20,710 | $5,216 | $15,494 |
| 2021 | $1,777 | $20,710 | $5,216 | $15,494 |
| 2020 | $1,601 | $19,766 | $5,216 | $14,550 |
| 2019 | $1,544 | $19,766 | $5,216 | $14,550 |
| 2018 | $1,132 | $13,491 | $2,333 | $11,158 |
| 2017 | $1,132 | $13,491 | $2,333 | $11,158 |
| 2016 | $1,111 | $12,960 | $2,762 | $10,198 |
Source: Public Records
Map
Nearby Homes
- 13801 Lowell Ave
- 6206 E 140th Terrace
- 13907 Falkirk Cir
- 6906 E 140th Place
- 13616 Winchester Ave
- 13920 Dundee Cir
- 6104 E 136th St
- 14100 Merrywood Ln
- 14051 Dunbar Ct
- 13501 Applewood Dr
- 13729 S U S 71 Hwy
- 13429 Winchester Ave
- 13420 Belmeade Ave
- 6810 E 143rd St
- 13419 Parker Ave
- 13408 Bristol Ave
- 13424 Parker Ave
- 6712 E 134th St
- 13321 Applewood Dr
- 14401 Saint Andrews Dr
- 13816 Bennington Ave
- 13808 Bennington Ave
- 13813 Bennington Ave
- 13820 Bennington Ave
- 13817 Bennington Ave
- 13809 Bennington Ave
- 13821 Bennington Ave
- 13805 Bennington Ave
- 13824 Bennington Ave
- 13800 Bennington Ave
- 13811 Lowell Ave
- 13809 Lowell Ave
- 13817 Lowell Ave
- 13825 Bennington Ave
- 13805 Lowell Ave
- 13821 Lowell Ave
- 13828 Bennington Ave
- 13716 Bennington Ave
- 6514 E 139th St
- 13801 Bennington Ave
Your Personal Tour Guide
Ask me questions while you tour the home.