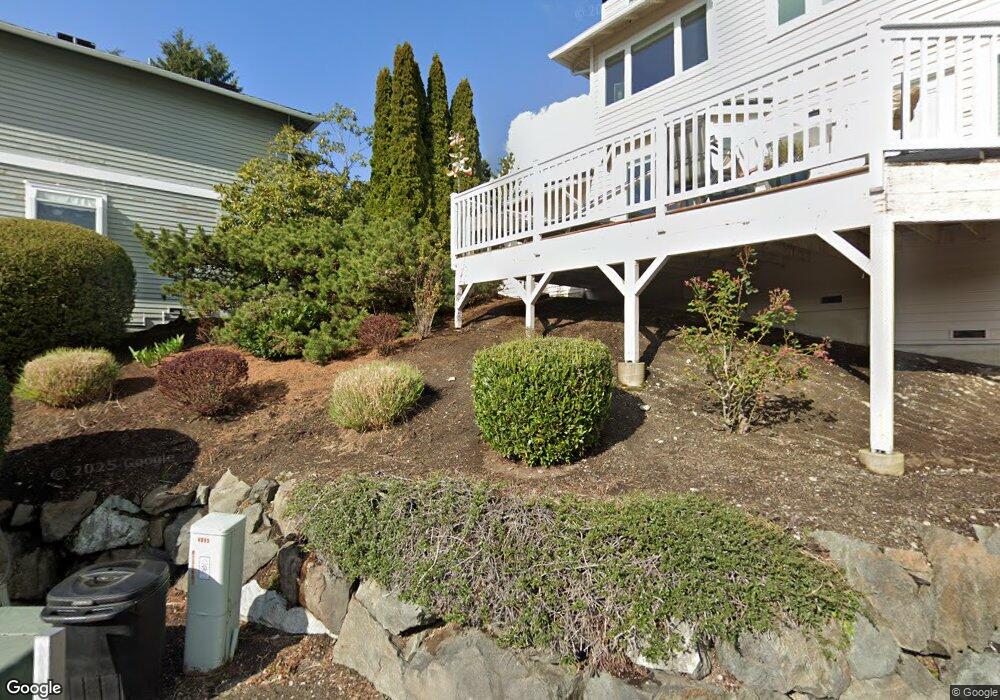
13813 65th Ave W Unit 5 Edmonds, WA 98026
Estimated Value: $728,615 - $947,000
2
Beds
3
Baths
1,656
Sq Ft
$507/Sq Ft
Est. Value
About This Home
This home is located at 13813 65th Ave W Unit 5, Edmonds, WA 98026 and is currently estimated at $838,904, approximately $506 per square foot. 13813 65th Ave W Unit 5 is a home located in Snohomish County with nearby schools including Picnic Point Elementary School, Harbour Pointe Middle School, and Kamiak High School.
Ownership History
Date
Name
Owned For
Owner Type
Purchase Details
Closed on
Jan 11, 2024
Sold by
Hansen Jane A
Bought by
2007 Jane A Hansen Family Trust and Hansen
Current Estimated Value
Purchase Details
Closed on
Jul 14, 2015
Sold by
Hoyt Tony B
Bought by
Hansen Hoyt Jane A
Home Financials for this Owner
Home Financials are based on the most recent Mortgage that was taken out on this home.
Original Mortgage
$372,400
Interest Rate
3.85%
Mortgage Type
New Conventional
Purchase Details
Closed on
Jul 9, 2015
Sold by
Al Abudlatif Fahad
Bought by
Hoyt Jane Hansen
Home Financials for this Owner
Home Financials are based on the most recent Mortgage that was taken out on this home.
Original Mortgage
$372,400
Interest Rate
3.85%
Mortgage Type
New Conventional
Purchase Details
Closed on
Mar 23, 2012
Sold by
Jenness Richard Ellis and Jenness Patricia Jones
Bought by
Al Abdulatif Fahad
Create a Home Valuation Report for This Property
The Home Valuation Report is an in-depth analysis detailing your home's value as well as a comparison with similar homes in the area
Home Values in the Area
Average Home Value in this Area
Purchase History
| Date | Buyer | Sale Price | Title Company |
|---|---|---|---|
| 2007 Jane A Hansen Family Trust | $313 | None Listed On Document | |
| Hansen Hoyt Jane A | -- | Old Republic Title Ltd | |
| Hoyt Jane Hansen | $392,000 | Old Republic Title Ltd | |
| Al Abdulatif Fahad | $305,280 | First American Title Ins Co |
Source: Public Records
Mortgage History
| Date | Status | Borrower | Loan Amount |
|---|---|---|---|
| Previous Owner | Hansen Hoyt Jane A | $372,400 | |
| Previous Owner | Hoyt Jane Hansen | $372,400 |
Source: Public Records
Tax History Compared to Growth
Tax History
| Year | Tax Paid | Tax Assessment Tax Assessment Total Assessment is a certain percentage of the fair market value that is determined by local assessors to be the total taxable value of land and additions on the property. | Land | Improvement |
|---|---|---|---|---|
| 2025 | $6,422 | $764,000 | $177,000 | $587,000 |
| 2024 | $6,422 | $764,000 | $164,000 | $600,000 |
| 2023 | $5,562 | $688,000 | $159,000 | $529,000 |
| 2022 | $6,217 | $655,000 | $127,500 | $527,500 |
| 2020 | $5,270 | $538,500 | $200,000 | $338,500 |
| 2019 | $4,840 | $496,200 | $180,000 | $316,200 |
| 2018 | $4,354 | $388,100 | $111,000 | $277,100 |
| 2017 | $4,075 | $372,000 | $55,500 | $316,500 |
| 2016 | $3,667 | $332,000 | $50,500 | $281,500 |
| 2015 | $3,620 | $300,000 | $50,500 | $249,500 |
| 2013 | $2,377 | $182,000 | $50,500 | $131,500 |
Source: Public Records
Map
Nearby Homes
- 13813 68th Ave W
- 6306 141st St SW
- 6625 136th Place SW
- 6420 141st St SW
- 13802 60th Ave W
- 6122 144th St SW
- 6520 146th St SW
- 6509 128th Place SW
- 6523 128th Place SW
- 6519 148th Place SW
- 14019 52nd Ave W Unit B
- 5119 136th St SW
- 14714 53rd Ave W Unit 116
- 14714 53rd Ave W Unit 119
- 5015 144th St SW Unit B1
- 5015 144th St SW Unit A4
- 5015 144th St SW Unit B3
- 5015 144th St SW Unit C1
- 11902 Possession Ln
- 14224 Beverly Park Rd Unit A
- 13813 65th Ave W Unit 10
- 13813 65th Ave W Unit 9
- 13813 65th Ave W Unit 8
- 13813 65th Ave W Unit 7
- 13813 65th Ave W Unit 6
- 13813 65th Ave W Unit 4
- 13813 65th Ave W Unit 3
- 13813 65th Ave W Unit 2
- 13813 65th Ave W Unit 9
- 6324 137th Place SW
- 6408 137th Place SW
- 6412 137th Place SW
- 6402 137th Place SW
- 13830 64th Place W
- 6330 137th Place SW
- 6430 137th Place SW
- 6320 137th Place SW
- 13902 64th Place W
- 6320 138th Place SW
- 6317 138th Place SW