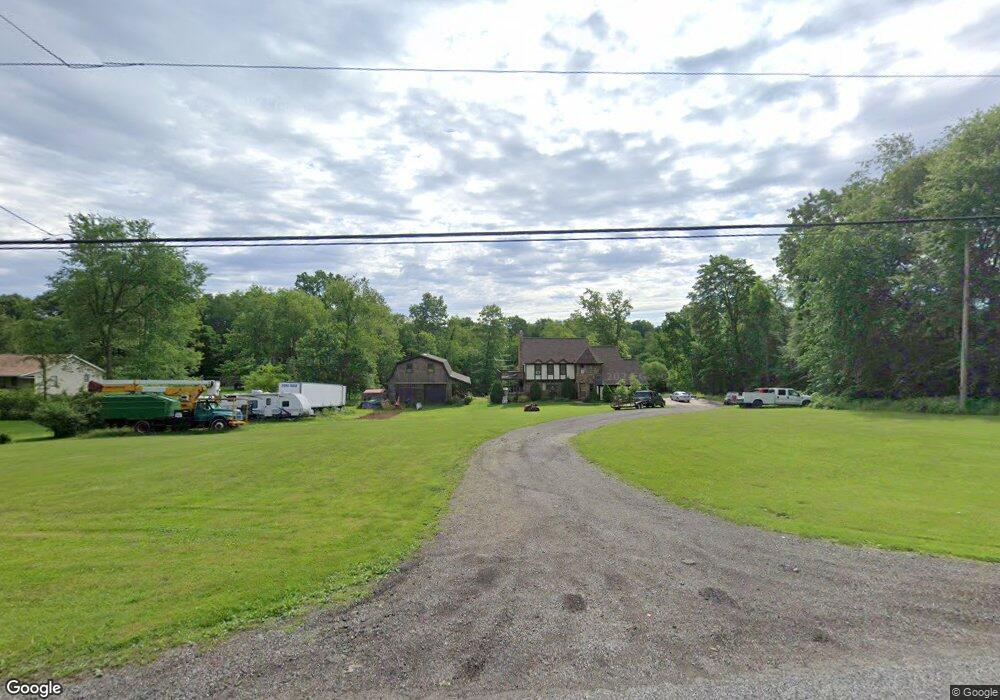
13813 Calaboone Rd Doylestown, OH 44230
Estimated Value: $363,000 - $567,766
3
Beds
3
Baths
2,367
Sq Ft
$185/Sq Ft
Est. Value
About This Home
This home is located at 13813 Calaboone Rd, Doylestown, OH 44230 and is currently estimated at $438,192, approximately $185 per square foot. 13813 Calaboone Rd is a home located in Wayne County with nearby schools including Hazel Harvey Elementary School, Chippewa Intermediate School, and Chippewa Jr./Sr. High School.
Ownership History
Date
Name
Owned For
Owner Type
Purchase Details
Closed on
Feb 11, 2021
Sold by
Mazer Jennifer R and Mazer Andrew L
Bought by
Mazer Jennifer R and Mazer Andrew L
Current Estimated Value
Home Financials for this Owner
Home Financials are based on the most recent Mortgage that was taken out on this home.
Original Mortgage
$187,900
Outstanding Balance
$137,066
Interest Rate
3%
Mortgage Type
New Conventional
Estimated Equity
$301,126
Purchase Details
Closed on
Sep 11, 2007
Sold by
Mazer Andrew L and Mazer Jennifer R
Bought by
Hopkins Charles R
Purchase Details
Closed on
Mar 24, 1995
Sold by
Willaman Frances
Bought by
Lane Jennifer R and Lane Andrew L
Create a Home Valuation Report for This Property
The Home Valuation Report is an in-depth analysis detailing your home's value as well as a comparison with similar homes in the area
Home Values in the Area
Average Home Value in this Area
Purchase History
| Date | Buyer | Sale Price | Title Company |
|---|---|---|---|
| Mazer Jennifer R | -- | Mortgage Connect Lp | |
| Hopkins Charles R | -- | Attorney | |
| Lane Jennifer R | $61,329 | -- |
Source: Public Records
Mortgage History
| Date | Status | Borrower | Loan Amount |
|---|---|---|---|
| Open | Mazer Jennifer R | $187,900 |
Source: Public Records
Tax History Compared to Growth
Tax History
| Year | Tax Paid | Tax Assessment Tax Assessment Total Assessment is a certain percentage of the fair market value that is determined by local assessors to be the total taxable value of land and additions on the property. | Land | Improvement |
|---|---|---|---|---|
| 2024 | $6,312 | $180,250 | $69,480 | $110,770 |
| 2023 | $6,312 | $180,250 | $69,480 | $110,770 |
| 2022 | $4,700 | $123,460 | $47,590 | $75,870 |
| 2021 | $4,796 | $123,460 | $47,590 | $75,870 |
| 2020 | $4,825 | $123,460 | $47,590 | $75,870 |
| 2019 | $4,441 | $109,610 | $42,150 | $67,460 |
| 2018 | $4,440 | $108,520 | $42,150 | $66,370 |
| 2017 | $4,343 | $108,520 | $42,150 | $66,370 |
| 2016 | $4,296 | $104,350 | $40,530 | $63,820 |
| 2015 | $4,281 | $104,350 | $40,530 | $63,820 |
| 2014 | $3,769 | $104,350 | $40,530 | $63,820 |
| 2013 | $3,954 | $106,250 | $43,090 | $63,160 |
Source: Public Records
Map
Nearby Homes
- 605 Vineyard Way
- 14328 Calaboone Rd
- 580 Thorn Way
- 325 Catawba Path
- 100 Merlot Ct
- 680 Thorn Way
- 620 Thorn Way
- 154 Circle Dr
- 517 N Portage St
- 436 N Portage St
- VL 1067 Homan Dr
- 18100 Grill Rd
- V/L 1050 Melanie Ln
- 46 Hidden Pond Dr
- 104 Homan Dr
- 77 Koehler Ave
- 340 Gates St
- 12214 Vince Dr
- 270 Maple St
- 0 S Portage St
- 13865 Calaboone Rd
- 13809 Calaboone Rd
- 13941 Calaboone Rd
- 216 Calaboone Rd
- V/L 1154 Calaboone Rd
- 130 Ridge Top Cir
- 170 Ridge Top Cir
- 13868 Allison Dr
- 110 Ridge Top Cir
- 190 Ridge Top Cir
- 90 Ridge Top Cir
- 70 Ridge Top Cir
- 13908 Calaboone Rd
- 136 Calaboone Rd
- 210 Ridge Top Cir
- 125 Ridge Top Cir
- 13838 Calaboone Rd
- 50 Ridge Top Cir
- 99999 Calaboone Rd
- 230 Ridge Top Cir