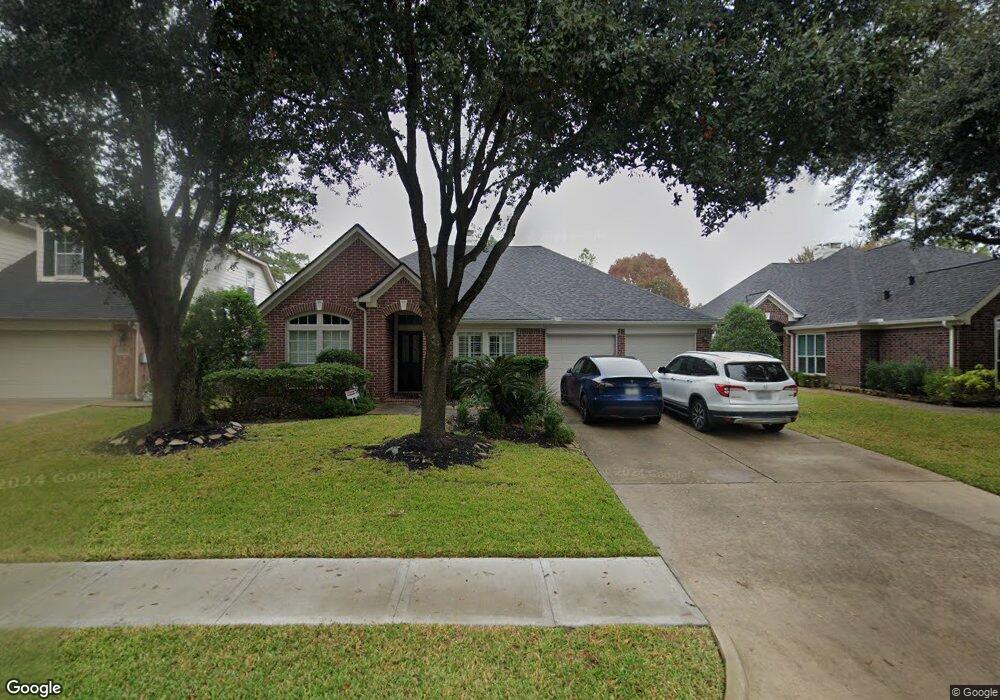
13819 Sherburn Manor Dr Cypress, TX 77429
Estimated Value: $416,232 - $456,000
4
Beds
3
Baths
2,589
Sq Ft
$167/Sq Ft
Est. Value
About This Home
This home is located at 13819 Sherburn Manor Dr, Cypress, TX 77429 and is currently estimated at $432,808, approximately $167 per square foot. 13819 Sherburn Manor Dr is a home located in Harris County with nearby schools including Sampson Elementary School, Spillane Middle School, and Cypress Woods High School.
Ownership History
Date
Name
Owned For
Owner Type
Purchase Details
Closed on
Oct 27, 2010
Sold by
Hopkins John and Hopkins Jennifer
Bought by
Huang Yong and Yu Xiaoguang
Current Estimated Value
Home Financials for this Owner
Home Financials are based on the most recent Mortgage that was taken out on this home.
Original Mortgage
$174,400
Interest Rate
4.22%
Mortgage Type
New Conventional
Purchase Details
Closed on
Mar 15, 2004
Sold by
Pearce Jason B and Pearce Kristin E
Bought by
Hopkins John and Hopkins Jennifer
Home Financials for this Owner
Home Financials are based on the most recent Mortgage that was taken out on this home.
Original Mortgage
$148,800
Interest Rate
5.71%
Mortgage Type
Purchase Money Mortgage
Purchase Details
Closed on
Jan 21, 2002
Sold by
Perry Homes
Bought by
Pearce Jason B and Pearce Kristin E
Home Financials for this Owner
Home Financials are based on the most recent Mortgage that was taken out on this home.
Original Mortgage
$173,288
Interest Rate
7.15%
Create a Home Valuation Report for This Property
The Home Valuation Report is an in-depth analysis detailing your home's value as well as a comparison with similar homes in the area
Home Values in the Area
Average Home Value in this Area
Purchase History
| Date | Buyer | Sale Price | Title Company |
|---|---|---|---|
| Huang Yong | -- | Closing Title Company | |
| Hopkins John | -- | Stewart Title Houston Div | |
| Pearce Jason B | -- | Chicago Title |
Source: Public Records
Mortgage History
| Date | Status | Borrower | Loan Amount |
|---|---|---|---|
| Previous Owner | Huang Yong | $174,400 | |
| Previous Owner | Hopkins John | $148,800 | |
| Previous Owner | Pearce Jason B | $173,288 |
Source: Public Records
Tax History Compared to Growth
Tax History
| Year | Tax Paid | Tax Assessment Tax Assessment Total Assessment is a certain percentage of the fair market value that is determined by local assessors to be the total taxable value of land and additions on the property. | Land | Improvement |
|---|---|---|---|---|
| 2025 | $6,045 | $411,162 | $103,598 | $307,564 |
| 2024 | $6,045 | $389,982 | $94,221 | $295,761 |
| 2023 | $6,045 | $402,696 | $94,221 | $308,475 |
| 2022 | $7,942 | $391,322 | $67,428 | $323,894 |
| 2021 | $7,669 | $302,990 | $67,428 | $235,562 |
| 2020 | $7,370 | $282,468 | $49,250 | $233,218 |
| 2019 | $6,940 | $266,000 | $49,250 | $216,750 |
| 2018 | $2,341 | $234,475 | $49,250 | $185,225 |
| 2017 | $7,213 | $268,000 | $49,250 | $218,750 |
| 2016 | $7,589 | $282,000 | $49,250 | $232,750 |
| 2015 | $5,371 | $302,349 | $49,250 | $253,099 |
| 2014 | $5,371 | $255,000 | $49,250 | $205,750 |
Source: Public Records
Map
Nearby Homes
- 13718 Sherburn Manor Dr
- 15923 Hurstfield Pointe Dr
- 14103 Sherburn Manor Dr
- 16219 Haden Crest Ct
- 16211 Halpren Falls Ln
- 14210 Prospect Point Dr
- 14126 Bloomingdale Manor Dr
- 13002 Huffmeister Rd
- 15922 Clipper Pointe Dr
- 13703 Layton Hills Dr
- 13926 Wessex Park Dr
- 16306 Bontura St
- 13611 Monteigne Ln
- 16322 Bontura St
- 13014 Vivienne Westmoreland Dr
- 16406 Haden Crest Ct
- 14314 Prosper Ridge Dr
- 14210 Northface Manor Ct
- 14207 Spindle Arbor Rd
- 14442 Gleaming Rose Dr
- 13815 Sherburn Manor Dr
- 13823 Sherburn Manor Dr
- 13811 Sherburn Manor Dr
- 13827 Sherburn Manor Dr
- 13814 Sherburn Manor Dr
- 13818 Sherburn Manor Dr
- 13807 Sherburn Manor Dr
- 13831 Sherburn Manor Dr
- 13810 Sherburn Manor Dr
- 13822 Sherburn Manor Dr
- 13803 Sherburn Manor Dr
- 13835 Sherburn Manor Dr
- 13806 Sherburn Manor Dr
- 15943 Cypress Hall Dr
- 13902 Mount Airy Ct
- 13902 Cantrell Manor
- 15926 Linwood Manor Ct
- 13802 Sherburn Manor Dr
- 15939 Cypress Hall Dr
- 13743 Sherburn Manor Dr