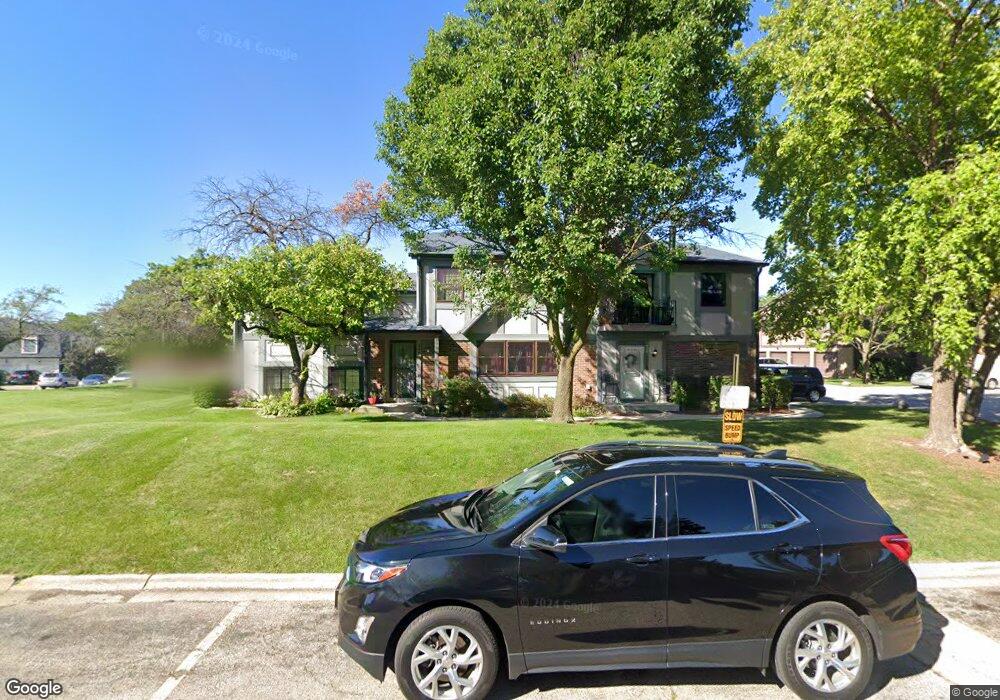
1382 Inverrary Ln Unit 5B Palatine, IL 60074
Capri Village NeighborhoodEstimated Value: $219,000 - $242,000
2
Beds
2
Baths
1,200
Sq Ft
$190/Sq Ft
Est. Value
About This Home
This home is located at 1382 Inverrary Ln Unit 5B, Palatine, IL 60074 and is currently estimated at $228,035, approximately $190 per square foot. 1382 Inverrary Ln Unit 5B is a home located in Cook County with nearby schools including Lake Louise Elementary School, Palatine High School, and Bright Horizons At Motorola-Arlington Hts.
Ownership History
Date
Name
Owned For
Owner Type
Purchase Details
Closed on
Oct 22, 2019
Sold by
Nichani Pam and Estate Of Mark Nichani
Bought by
Coscio Jonathan and Coscio Erika
Current Estimated Value
Home Financials for this Owner
Home Financials are based on the most recent Mortgage that was taken out on this home.
Original Mortgage
$133,000
Outstanding Balance
$89,229
Interest Rate
3.75%
Mortgage Type
New Conventional
Estimated Equity
$138,806
Purchase Details
Closed on
Jan 14, 1994
Sold by
Grady Steven M and Grady Michelle M
Bought by
Nichani Mark H
Home Financials for this Owner
Home Financials are based on the most recent Mortgage that was taken out on this home.
Original Mortgage
$93,600
Interest Rate
7.26%
Mortgage Type
FHA
Create a Home Valuation Report for This Property
The Home Valuation Report is an in-depth analysis detailing your home's value as well as a comparison with similar homes in the area
Home Values in the Area
Average Home Value in this Area
Purchase History
| Date | Buyer | Sale Price | Title Company |
|---|---|---|---|
| Coscio Jonathan | $140,000 | Old Republic National Title | |
| Nichani Mark H | $64,333 | -- | |
| Nichani Mark H | $64,333 | -- |
Source: Public Records
Mortgage History
| Date | Status | Borrower | Loan Amount |
|---|---|---|---|
| Open | Coscio Jonathan | $133,000 | |
| Previous Owner | Nichani Mark H | $93,600 |
Source: Public Records
Tax History Compared to Growth
Tax History
| Year | Tax Paid | Tax Assessment Tax Assessment Total Assessment is a certain percentage of the fair market value that is determined by local assessors to be the total taxable value of land and additions on the property. | Land | Improvement |
|---|---|---|---|---|
| 2024 | $3,308 | $14,489 | $2,086 | $12,403 |
| 2023 | $3,170 | $14,489 | $2,086 | $12,403 |
| 2022 | $3,170 | $14,489 | $2,086 | $12,403 |
| 2021 | $2,701 | $11,648 | $1,765 | $9,883 |
| 2020 | $3,726 | $11,648 | $1,765 | $9,883 |
| 2019 | $3,744 | $13,053 | $1,765 | $11,288 |
| 2018 | $2,834 | $9,118 | $1,604 | $7,514 |
| 2017 | $2,780 | $9,118 | $1,604 | $7,514 |
| 2016 | $2,585 | $9,118 | $1,604 | $7,514 |
| 2015 | $2,034 | $6,621 | $1,444 | $5,177 |
| 2014 | $2,010 | $6,621 | $1,444 | $5,177 |
| 2013 | $1,958 | $6,621 | $1,444 | $5,177 |
Source: Public Records
Map
Nearby Homes
- 1259 Inverrary Ln Unit 27D
- 2B E Dundee Quarter Dr Unit 101
- 6A E Dundee Quarter Dr Unit 207
- 5A E Dundee Quarter Dr Unit 206
- 10A E Dundee Quarter Dr Unit 306
- 10B E Dundee Quarter Dr Unit 301
- 1275 E Baldwin Ln Unit 507
- 1275 E Baldwin Ln Unit 601
- 1275 E Baldwin Ln Unit 408
- 1275 E Baldwin Ln Unit 504
- 2134 N Ginger Creek Dr Unit 19D
- 2044 N Ginger Creek Dr Unit 30C
- 2500 Bayside Dr Unit 3
- 1325 N Baldwin Ct Unit VIID1
- 1005 E Lilac Dr
- 1168 Foxglove Ln Unit 6C
- 1144 Foxglove Ln Unit 4A
- 4000 Bayside Dr Unit 205
- 1000 Bayside Dr Unit 212
- 175 E Lilly Ln
- 1380 Inverrary Ln Unit 5A
- 1384 Inverrary Ln Unit 5C
- 1386 Inverrary Ln Unit 5D
- 1366 Inverrary Ln Unit 4C
- 1368 Inverrary Ln Unit 4B
- 1364 Inverrary Ln Unit 4D
- 1370 Inverrary Ln Unit 4A
- 1388 Inverrary Ln Unit 1A
- 1304 Inverrary Ln Unit 6C
- 1306 Inverrary Ln Unit 6D
- 1302 Inverrary Ln Unit 6B
- 1315 Inverrary Ln Unit 34D
- 1311 Inverrary Ln Unit 34B
- 1300 Inverrary Ln Unit 6A
- 1313 Inverrary Ln Unit 34C
- 1374 Inverrary Ln Unit 2B
- 1372 Inverrary Ln Unit 2A
- 1376 Inverrary Ln Unit 2C
- 1394 Inverrary Ln Unit 1D