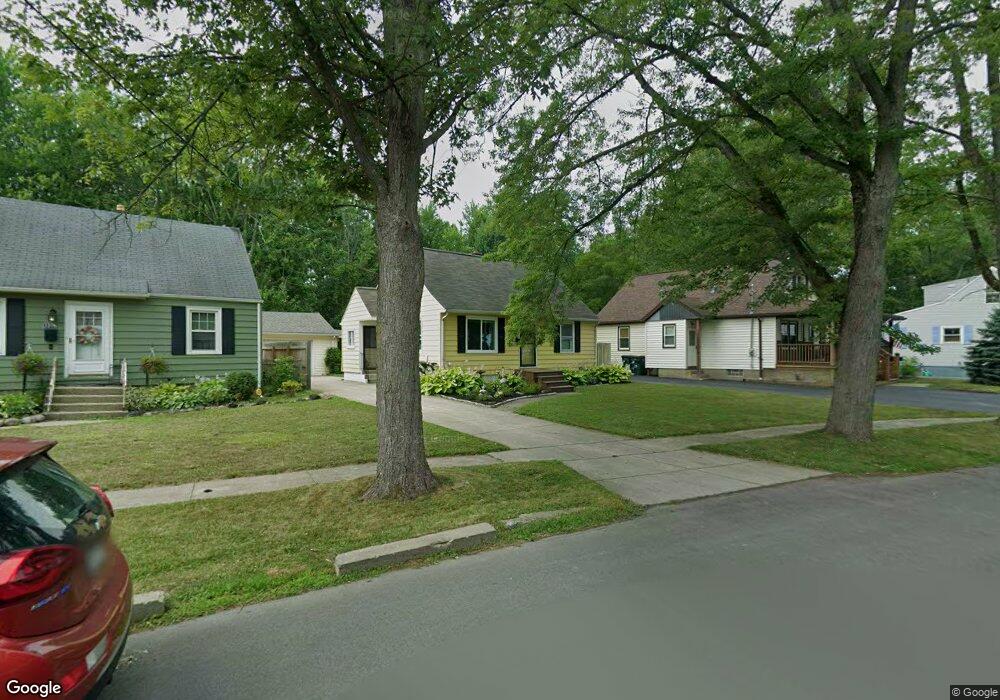
1382 Weaver Pkwy North Tonawanda, NY 14120
Estimated Value: $185,000 - $248,000
3
Beds
1
Bath
1,080
Sq Ft
$206/Sq Ft
Est. Value
About This Home
This home is located at 1382 Weaver Pkwy, North Tonawanda, NY 14120 and is currently estimated at $222,038, approximately $205 per square foot. 1382 Weaver Pkwy is a home located in Niagara County with nearby schools including Drake School, St Matthew Lutheran School, and St. John Lutheran School.
Ownership History
Date
Name
Owned For
Owner Type
Purchase Details
Closed on
Oct 20, 2025
Sold by
Kabalan Katharine Lynn and Kagelmacher Daniel
Bought by
Kabalan Christopher B
Current Estimated Value
Home Financials for this Owner
Home Financials are based on the most recent Mortgage that was taken out on this home.
Original Mortgage
$180,000
Outstanding Balance
$179,831
Interest Rate
6.3%
Mortgage Type
New Conventional
Estimated Equity
$42,207
Purchase Details
Closed on
Feb 21, 2025
Sold by
Kabalan Katharine Lynn
Bought by
Kabalan Katharine Lynn and Kagelmacher Daniel
Purchase Details
Closed on
Dec 5, 2017
Sold by
Schumacher Barbara A
Bought by
Kabalan Katharine Lynn
Home Financials for this Owner
Home Financials are based on the most recent Mortgage that was taken out on this home.
Original Mortgage
$25,000
Interest Rate
3.9%
Mortgage Type
Seller Take Back
Purchase Details
Closed on
Nov 13, 1995
Create a Home Valuation Report for This Property
The Home Valuation Report is an in-depth analysis detailing your home's value as well as a comparison with similar homes in the area
Home Values in the Area
Average Home Value in this Area
Purchase History
| Date | Buyer | Sale Price | Title Company |
|---|---|---|---|
| Kabalan Christopher B | $225,000 | None Listed On Document | |
| Kabalan Katharine Lynn | -- | None Listed On Document | |
| Kabalan Katharine Lynn | $50,000 | -- | |
| Schumacher Barbara A | -- | -- | |
| -- | -- | -- |
Source: Public Records
Mortgage History
| Date | Status | Borrower | Loan Amount |
|---|---|---|---|
| Open | Kabalan Christopher B | $180,000 | |
| Previous Owner | Kabalan Katharine Lynn | $25,000 |
Source: Public Records
Tax History Compared to Growth
Tax History
| Year | Tax Paid | Tax Assessment Tax Assessment Total Assessment is a certain percentage of the fair market value that is determined by local assessors to be the total taxable value of land and additions on the property. | Land | Improvement |
|---|---|---|---|---|
| 2024 | $2,913 | $82,500 | $15,400 | $67,100 |
| 2023 | $2,840 | $82,500 | $15,400 | $67,100 |
| 2022 | $2,809 | $82,500 | $15,400 | $67,100 |
| 2021 | $2,791 | $82,500 | $15,400 | $67,100 |
| 2020 | $2,732 | $82,500 | $15,400 | $67,100 |
| 2019 | $1,295 | $82,500 | $15,400 | $67,100 |
| 2018 | $3,153 | $82,500 | $15,400 | $67,100 |
| 2017 | $1,988 | $82,500 | $15,400 | $67,100 |
| 2016 | $1,000 | $82,500 | $15,400 | $67,100 |
| 2015 | -- | $82,500 | $15,400 | $67,100 |
| 2014 | -- | $82,500 | $15,400 | $67,100 |
Source: Public Records
Map
Nearby Homes
- 86 Community Dr
- 298 Ward Rd
- 186 E Felton St
- 88 E Felton St
- 77 Porter Ave
- 1201 Payne Ave
- 339 Daniel Dr
- 257 Fredericka St
- 399 Frontier Ave
- 376 Roger Ave
- 222 Fredericka St
- 33 Jackson Ave
- 81 Northeast Ave
- 729 Ruie Rd
- 864 Ruie Rd
- 1255 Doebler Dr
- 1091 Ruie Rd
- 1317 Master St
- 843 Payne Ave
- 104 Oakwood Terrace
- 1376 Weaver Pkwy
- 1388 Weaver Pkwy
- 1392 Weaver Pkwy
- 1370 Weaver Pkwy
- 1398 Weaver Pkwy
- 1377 Weaver Pkwy
- 112 Community Dr
- 1404 Weaver Pkwy
- 1383 Weaver Pkwy
- 1391 Weaver Pkwy
- 1408 Weaver Pkwy
- 120 Community Dr
- 1397 Weaver Pkwy
- 1414 Weaver Pkwy
- 1405 Weaver Pkwy
- 103 Community Dr Unit 3
- 103 Community Dr Unit 4
- 95 Community Dr
- 109 Community Dr Unit 109 Community Drive
- 109 Community Dr