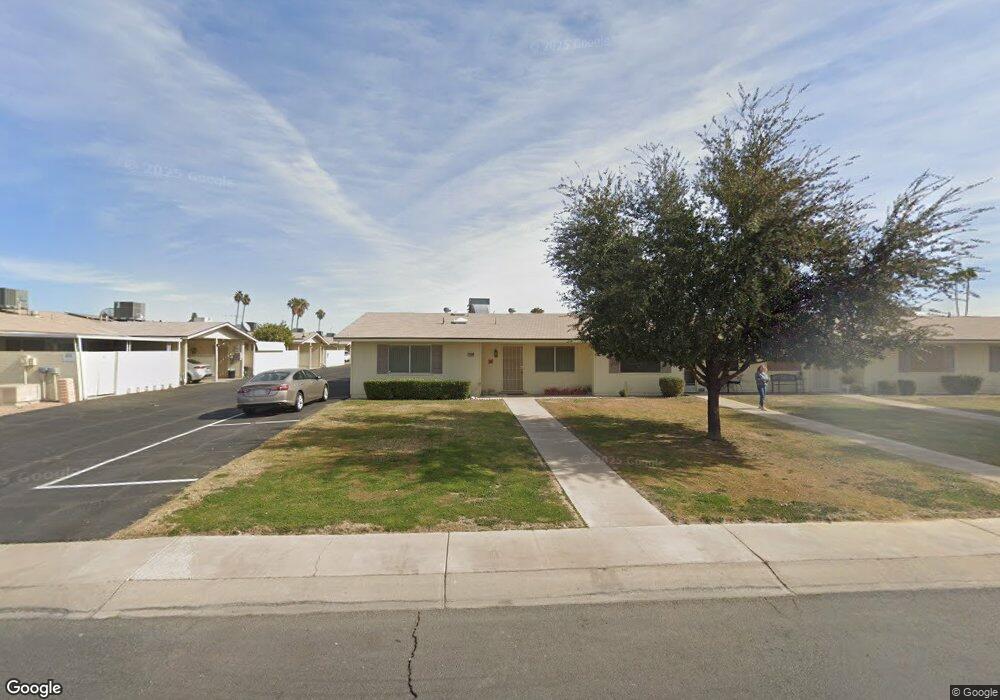
13822 N Silverbell Dr Sun City, AZ 85351
Estimated Value: $194,000 - $206,000
2
Beds
2
Baths
1,318
Sq Ft
$151/Sq Ft
Est. Value
About This Home
This home is located at 13822 N Silverbell Dr, Sun City, AZ 85351 and is currently estimated at $198,732, approximately $150 per square foot. 13822 N Silverbell Dr is a home located in Maricopa County with nearby schools including Desert Mirage Elementary School.
Ownership History
Date
Name
Owned For
Owner Type
Purchase Details
Closed on
Feb 9, 2023
Sold by
Griffin Darrell E
Bought by
Griffin Donna L and Taylor Diana F
Current Estimated Value
Purchase Details
Closed on
Jul 24, 2017
Sold by
Simpson Dorothy Isabella and The Simpson Family Truist
Bought by
Murray Randy
Home Financials for this Owner
Home Financials are based on the most recent Mortgage that was taken out on this home.
Original Mortgage
$85,000
Interest Rate
3.88%
Mortgage Type
VA
Purchase Details
Closed on
Oct 14, 1997
Sold by
Price Rolen A and Price Allise L
Bought by
Griffin Patricia A
Home Financials for this Owner
Home Financials are based on the most recent Mortgage that was taken out on this home.
Original Mortgage
$52,900
Interest Rate
7.36%
Mortgage Type
New Conventional
Purchase Details
Closed on
Mar 29, 1995
Sold by
Ryan Philip A and Ryan Eileen B
Bought by
Price Rolen A and Price Allise L
Create a Home Valuation Report for This Property
The Home Valuation Report is an in-depth analysis detailing your home's value as well as a comparison with similar homes in the area
Home Values in the Area
Average Home Value in this Area
Purchase History
| Date | Buyer | Sale Price | Title Company |
|---|---|---|---|
| Griffin Donna L | -- | -- | |
| Murray Randy | $85,000 | Lawyers Title Of Arizona Inc | |
| Griffin Patricia A | $66,900 | Ati Title Agency | |
| Price Rolen A | $69,900 | United Title Agency |
Source: Public Records
Mortgage History
| Date | Status | Borrower | Loan Amount |
|---|---|---|---|
| Previous Owner | Murray Randy | $85,000 | |
| Previous Owner | Griffin Patricia A | $52,900 |
Source: Public Records
Tax History Compared to Growth
Tax History
| Year | Tax Paid | Tax Assessment Tax Assessment Total Assessment is a certain percentage of the fair market value that is determined by local assessors to be the total taxable value of land and additions on the property. | Land | Improvement |
|---|---|---|---|---|
| 2025 | $600 | $6,927 | -- | -- |
| 2024 | $542 | $6,597 | -- | -- |
| 2023 | $542 | $15,670 | $3,130 | $12,540 |
| 2022 | $518 | $13,210 | $2,640 | $10,570 |
| 2021 | $530 | $11,980 | $2,390 | $9,590 |
| 2020 | $516 | $10,520 | $2,100 | $8,420 |
| 2019 | $496 | $8,650 | $1,730 | $6,920 |
| 2018 | $485 | $7,680 | $1,530 | $6,150 |
| 2017 | $471 | $6,360 | $1,270 | $5,090 |
| 2016 | $274 | $5,250 | $1,050 | $4,200 |
| 2015 | $416 | $4,620 | $920 | $3,700 |
Source: Public Records
Map
Nearby Homes
- 13822 N Silverbell Dr Unit 15C
- 13808 N Silverbell Dr Unit 69
- 13677 N Newcastle Dr Unit 15C
- 13642 N Silverbell Dr
- 13822 N Newcastle Dr Unit 130
- 13632 N Silverbell Dr Unit 55
- 13807 N Garden Court Dr Unit 144
- 11120 W Desert Butte Dr
- 14044 N Newcastle Dr Unit 15C
- 13653 N 111th Ave
- 13612 N 111th Ave Unit 6
- 13671 N 111th Ave Unit 15B
- 14023 N Newcastle Dr
- 13641 N 111th Ave Unit 106
- 14022 N Palm Ridge Dr W
- 14020 N Palm Ridge Dr W Unit 17H
- 13601 N 111th Ave Unit 118
- 13833 N 111th Ave
- 11014 W Santa fe Dr Unit 64
- 14090 N Newcastle Dr
- 13820 N Silverbell Dr
- 13818 N Silverbell Dr
- 13809 N Newcastle Dr
- 13807 N Newcastle Dr
- 13807 N Newcastle Dr
- 11129 W Emerald Dr
- 11131 W Emerald Dr Unit 82
- 13816 N Silverbell Dr
- 11127 W Emerald Dr
- 13805 N Newcastle Dr
- 11133 W Emerald Dr Unit 15C
- 11125 W Emerald Dr Unit 79
- 13803 N Newcastle Dr
- 13814 N Silverbell Dr
- 11123 W Emerald Dr
- 11135 W Emerald Dr
- 13801 N Newcastle Dr
- 13812 N Silverbell Dr
- 13810 N Silverbell Dr Unit 70
- 11121 W Emerald Dr Unit 77