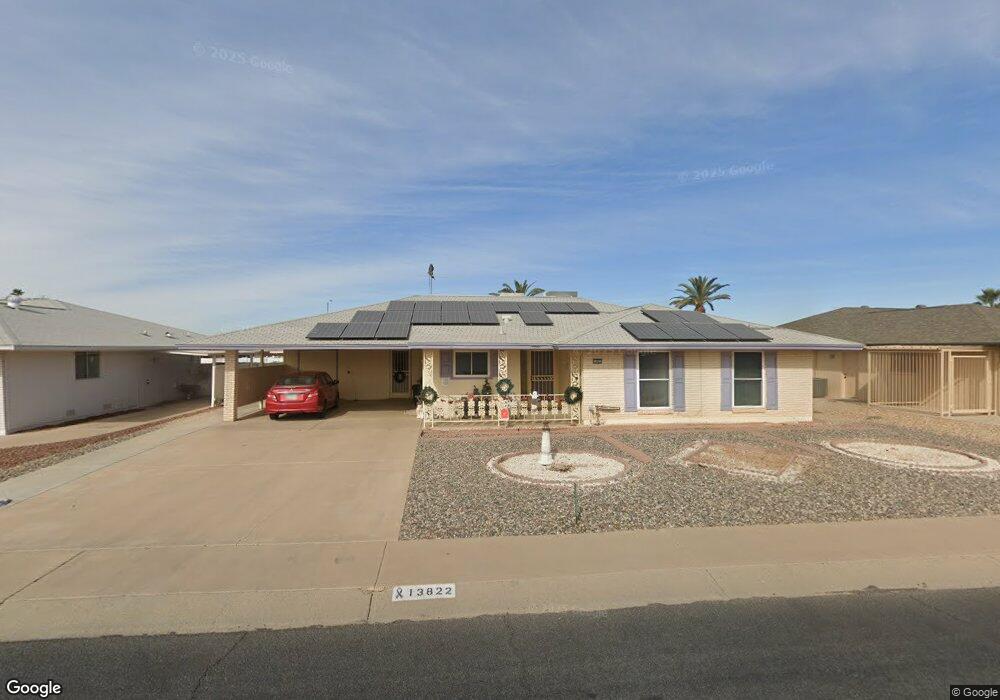
13822 N Whispering Lake Dr Sun City, AZ 85351
Estimated Value: $252,701 - $356,000
--
Bed
2
Baths
1,689
Sq Ft
$187/Sq Ft
Est. Value
About This Home
This home is located at 13822 N Whispering Lake Dr, Sun City, AZ 85351 and is currently estimated at $316,425, approximately $187 per square foot. 13822 N Whispering Lake Dr is a home located in Maricopa County with nearby schools including Desert Mirage Elementary School, Sonoran Science Academy-Peoria, and Ombudsman - Northwest Charter.
Ownership History
Date
Name
Owned For
Owner Type
Purchase Details
Closed on
Mar 30, 2016
Sold by
Harmell Sheila M
Bought by
Harmell Sheila M
Current Estimated Value
Home Financials for this Owner
Home Financials are based on the most recent Mortgage that was taken out on this home.
Original Mortgage
$255,000
Interest Rate
4.35%
Mortgage Type
Reverse Mortgage Home Equity Conversion Mortgage
Purchase Details
Closed on
Apr 12, 2011
Sold by
Harmell Sheila M
Bought by
Harmell Ferne V and Harmell Sheila M
Purchase Details
Closed on
Aug 19, 2010
Sold by
Harmell Ferne V
Bought by
Harmel Sheila M
Purchase Details
Closed on
Jul 26, 2005
Sold by
Harmell Ferne V
Bought by
Harnell Ferne V and Harmell Sheila M
Purchase Details
Closed on
Feb 19, 2003
Sold by
Harmell Wallace L and Harmell Ferne V
Bought by
Harmell Ferne V
Create a Home Valuation Report for This Property
The Home Valuation Report is an in-depth analysis detailing your home's value as well as a comparison with similar homes in the area
Home Values in the Area
Average Home Value in this Area
Purchase History
| Date | Buyer | Sale Price | Title Company |
|---|---|---|---|
| Harmell Sheila M | -- | Lawyers Title Of Arizona Inc | |
| Harmell Ferne V | -- | None Available | |
| Harmel Sheila M | -- | None Available | |
| Harnell Ferne V | -- | -- | |
| Harmell Ferne V | -- | -- |
Source: Public Records
Mortgage History
| Date | Status | Borrower | Loan Amount |
|---|---|---|---|
| Closed | Harmell Sheila M | $255,000 |
Source: Public Records
Tax History Compared to Growth
Tax History
| Year | Tax Paid | Tax Assessment Tax Assessment Total Assessment is a certain percentage of the fair market value that is determined by local assessors to be the total taxable value of land and additions on the property. | Land | Improvement |
|---|---|---|---|---|
| 2025 | $1,112 | $13,768 | -- | -- |
| 2024 | $1,003 | $13,113 | -- | -- |
| 2023 | $1,003 | $23,000 | $4,600 | $18,400 |
| 2022 | $944 | $18,130 | $3,620 | $14,510 |
| 2021 | $975 | $17,060 | $3,410 | $13,650 |
| 2020 | $949 | $14,870 | $2,970 | $11,900 |
| 2019 | $936 | $13,780 | $2,750 | $11,030 |
| 2018 | $901 | $12,430 | $2,480 | $9,950 |
| 2017 | $870 | $10,950 | $2,190 | $8,760 |
| 2016 | $815 | $10,330 | $2,060 | $8,270 |
| 2015 | $780 | $9,480 | $1,890 | $7,590 |
Source: Public Records
Map
Nearby Homes
- 13828 N Whispering Lake Dr
- 10309 W Floriade Dr Unit 18
- 13832 N Crown Point
- 13836 N Kaanapali Dr
- 10306 W Cameo Dr
- 10229 W Bolivar Dr
- 10329 W Floriade Dr
- 10134 W Forrester Dr
- 10012 W Bolivar Dr
- 10137 W Forrester Dr Unit 20
- 13636 N Redwood Dr Unit 203
- 10322 W Cameo Dr
- 13825 N Kaanapali Dr
- 10127 W Forrester Dr
- 13620 N Hawthorn Dr
- 10112 W Forrester Dr
- 14218 N Mcphee Dr
- 13614 N Hawthorn Dr
- 10330 W Cameo Dr
- 10114 W Candlewood Dr
- 13820 N Whispering Lake Dr
- 13824 N Whispering Lake Dr
- 14023 N 103rd Ave
- 14029 N 103rd Ave
- 13818 N Whispering Lake Dr
- 14017 N 103rd Ave
- 13826 N Whispering Lake Dr
- 13826 N Whispering Lake Dr
- 14035 N 103rd Ave
- 13827 N Lakeshore Point
- 13823 N Whispering Lake Dr
- 14013 N 103rd Ave
- 13816 N Whispering Lake Dr
- 14041 N 103rd Ave
- 13825 N Whispering Lake Dr
- 13815 N Whispering Lake Dr
- 13823 N Lakeshore Point
- 14001 N 103rd Ave
- 13814 N Whispering Lake Dr
- 13826 N Lakeshore Point