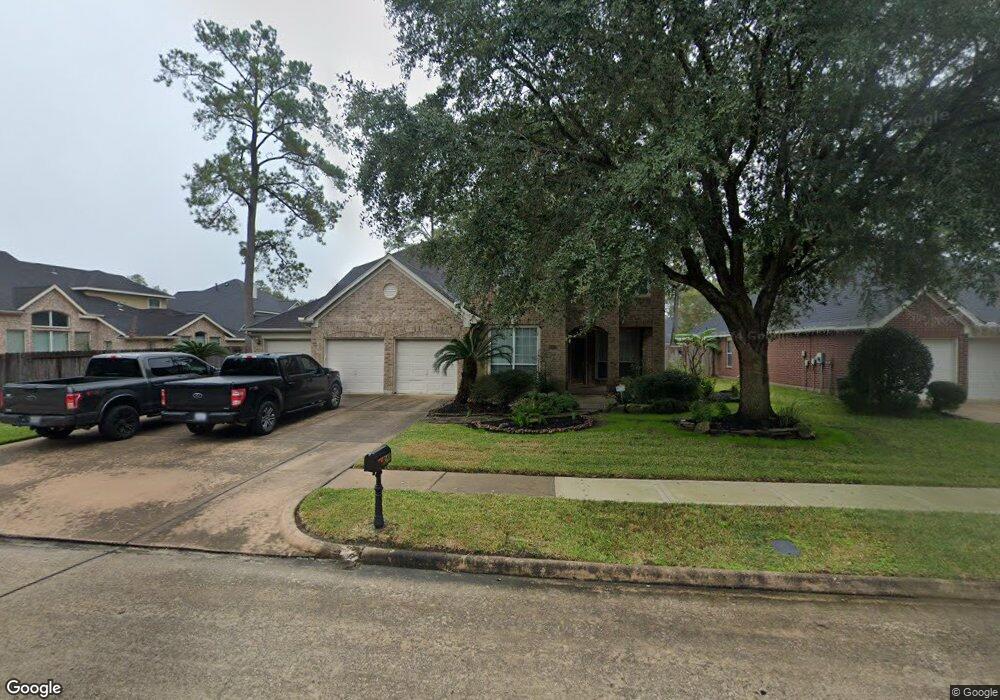
13822 Sherburn Manor Dr Cypress, TX 77429
Estimated Value: $538,605 - $569,000
4
Beds
4
Baths
3,279
Sq Ft
$169/Sq Ft
Est. Value
About This Home
This home is located at 13822 Sherburn Manor Dr, Cypress, TX 77429 and is currently estimated at $554,651, approximately $169 per square foot. 13822 Sherburn Manor Dr is a home located in Harris County with nearby schools including Sampson Elementary School, Spillane Middle School, and Cypress Woods High School.
Ownership History
Date
Name
Owned For
Owner Type
Purchase Details
Closed on
Mar 11, 2022
Sold by
Taylor Coats Aaron
Bought by
Pham My H
Current Estimated Value
Purchase Details
Closed on
Nov 18, 2016
Sold by
Vaughn Craig Allen
Bought by
Vaughn Misti Kay
Purchase Details
Closed on
Jun 30, 2003
Sold by
Tanzi Kevin V and Tanzi Michelle J
Bought by
Vaughn Craig A and Vaughn Misti K
Home Financials for this Owner
Home Financials are based on the most recent Mortgage that was taken out on this home.
Original Mortgage
$192,000
Interest Rate
5.27%
Mortgage Type
Purchase Money Mortgage
Purchase Details
Closed on
Jul 30, 2002
Sold by
Perry Homes
Bought by
Tanzi Kevin and Tanzi Michelle J
Home Financials for this Owner
Home Financials are based on the most recent Mortgage that was taken out on this home.
Original Mortgage
$214,085
Interest Rate
6.62%
Create a Home Valuation Report for This Property
The Home Valuation Report is an in-depth analysis detailing your home's value as well as a comparison with similar homes in the area
Home Values in the Area
Average Home Value in this Area
Purchase History
| Date | Buyer | Sale Price | Title Company |
|---|---|---|---|
| Pham My H | -- | Old Republic National Title In | |
| Vaughn Misti Kay | -- | None Available | |
| Vaughn Craig A | -- | Chicago Title Insurance Comp | |
| Tanzi Kevin | -- | Chicago Title |
Source: Public Records
Mortgage History
| Date | Status | Borrower | Loan Amount |
|---|---|---|---|
| Previous Owner | Vaughn Craig A | $192,000 | |
| Previous Owner | Tanzi Kevin | $214,085 | |
| Closed | Vaughn Craig A | $24,000 |
Source: Public Records
Tax History Compared to Growth
Tax History
| Year | Tax Paid | Tax Assessment Tax Assessment Total Assessment is a certain percentage of the fair market value that is determined by local assessors to be the total taxable value of land and additions on the property. | Land | Improvement |
|---|---|---|---|---|
| 2025 | $6,545 | $507,318 | $104,635 | $402,683 |
| 2024 | $6,545 | $511,709 | $95,164 | $416,545 |
| 2023 | $6,545 | $511,709 | $95,164 | $416,545 |
| 2022 | $8,220 | $424,090 | $68,103 | $355,987 |
| 2021 | $7,936 | $360,997 | $68,103 | $292,894 |
| 2020 | $7,438 | $285,055 | $50,024 | $235,031 |
| 2019 | $8,004 | $297,489 | $50,024 | $247,465 |
| 2018 | $2,912 | $284,004 | $50,024 | $233,980 |
| 2017 | $7,966 | $296,000 | $50,024 | $245,976 |
| 2016 | $8,478 | $315,000 | $50,024 | $264,976 |
| 2015 | $6,374 | $325,000 | $50,024 | $274,976 |
| 2014 | $6,374 | $285,400 | $50,024 | $235,376 |
Source: Public Records
Map
Nearby Homes
- 13718 Sherburn Manor Dr
- 15923 Hurstfield Pointe Dr
- 14103 Sherburn Manor Dr
- 14210 Prospect Point Dr
- 16219 Haden Crest Ct
- 13002 Huffmeister Rd
- 16211 Halpren Falls Ln
- 15922 Clipper Pointe Dr
- 13611 Monteigne Ln
- 16306 Bontura St
- 14126 Bloomingdale Manor Dr
- 13926 Wessex Park Dr
- 14314 Prosper Ridge Dr
- 13703 Layton Hills Dr
- 13014 Vivienne Westmoreland Dr
- 16322 Bontura St
- 14442 Gleaming Rose Dr
- 15803 Stiller Park Dr
- 16406 Haden Crest Ct
- 14539 Gleaming Rose Dr
- 13818 Sherburn Manor Dr
- 15943 Cypress Hall Dr
- 15939 Cypress Hall Dr
- 13814 Sherburn Manor Dr
- 15935 Cypress Hall Dr
- 15922 Linwood Manor Ct
- 15926 Linwood Manor Ct
- 13827 Sherburn Manor Dr
- 15931 Cypress Hall Dr
- 13810 Sherburn Manor Dr
- 13823 Sherburn Manor Dr
- 13831 Sherburn Manor Dr
- 13819 Sherburn Manor Dr
- 13835 Sherburn Manor Dr
- 15918 Linwood Manor Ct
- 15927 Cypress Hall Dr
- 13815 Sherburn Manor Dr
- 13839 Sherburn Manor Dr
- 13806 Sherburn Manor Dr
- 15938 Cypress Hall Dr