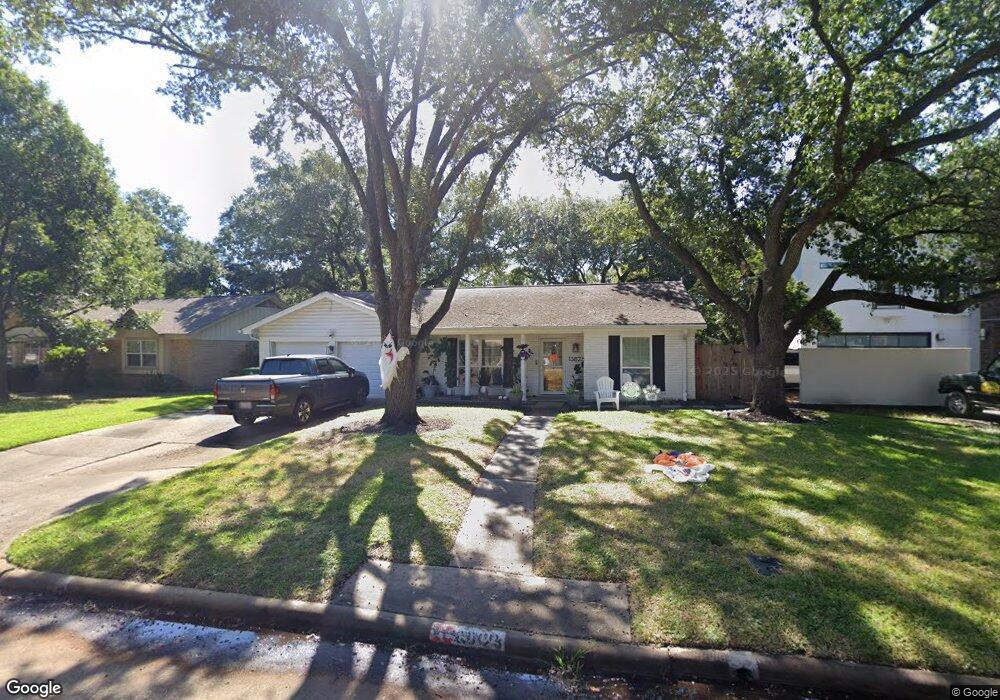
13823 Britoak Ln Houston, TX 77079
Memorial NeighborhoodEstimated Value: $702,000 - $943,000
4
Beds
2
Baths
2,259
Sq Ft
$355/Sq Ft
Est. Value
About This Home
This home is located at 13823 Britoak Ln, Houston, TX 77079 and is currently estimated at $801,279, approximately $354 per square foot. 13823 Britoak Ln is a home located in Harris County with nearby schools including Wilchester Elementary School, Memorial Middle, and Stratford High School.
Ownership History
Date
Name
Owned For
Owner Type
Purchase Details
Closed on
Aug 28, 2019
Sold by
Warren Natalie J and Warren John C
Bought by
Cao Hoang and Cao Thuy
Current Estimated Value
Home Financials for this Owner
Home Financials are based on the most recent Mortgage that was taken out on this home.
Original Mortgage
$500,000
Outstanding Balance
$439,742
Interest Rate
3.8%
Mortgage Type
New Conventional
Estimated Equity
$361,537
Purchase Details
Closed on
Apr 11, 2002
Sold by
Dusek Kenneth Michael
Bought by
Oliphant Paul
Home Financials for this Owner
Home Financials are based on the most recent Mortgage that was taken out on this home.
Original Mortgage
$198,900
Interest Rate
6.8%
Purchase Details
Closed on
Dec 29, 1995
Sold by
Lawson Stuart M and Beich Fritz P
Bought by
Dusek Kenneth Michael and Dusek Lori K
Home Financials for this Owner
Home Financials are based on the most recent Mortgage that was taken out on this home.
Original Mortgage
$20,000
Interest Rate
7.34%
Create a Home Valuation Report for This Property
The Home Valuation Report is an in-depth analysis detailing your home's value as well as a comparison with similar homes in the area
Home Values in the Area
Average Home Value in this Area
Purchase History
| Date | Buyer | Sale Price | Title Company |
|---|---|---|---|
| Cao Hoang | -- | Alamo Title Company | |
| Oliphant Paul | -- | Charter Title Company | |
| Dusek Kenneth Michael | -- | -- |
Source: Public Records
Mortgage History
| Date | Status | Borrower | Loan Amount |
|---|---|---|---|
| Open | Cao Hoang | $500,000 | |
| Previous Owner | Oliphant Paul | $198,900 | |
| Previous Owner | Dusek Kenneth Michael | $20,000 |
Source: Public Records
Tax History Compared to Growth
Tax History
| Year | Tax Paid | Tax Assessment Tax Assessment Total Assessment is a certain percentage of the fair market value that is determined by local assessors to be the total taxable value of land and additions on the property. | Land | Improvement |
|---|---|---|---|---|
| 2025 | $10,475 | $751,264 | $417,863 | $333,401 |
| 2024 | $10,475 | $655,046 | $417,863 | $237,183 |
| 2023 | $10,475 | $595,826 | $417,863 | $177,963 |
| 2022 | $13,344 | $570,743 | $379,875 | $190,868 |
| 2021 | $13,113 | $606,900 | $341,888 | $265,012 |
| 2020 | $12,234 | $488,285 | $341,888 | $146,397 |
| 2019 | $13,483 | $515,000 | $341,888 | $173,112 |
| 2018 | $5,051 | $516,066 | $341,888 | $174,178 |
| 2017 | $13,501 | $516,066 | $341,888 | $174,178 |
| 2016 | $12,950 | $495,000 | $341,888 | $153,112 |
| 2015 | $8,938 | $547,141 | $341,888 | $205,253 |
| 2014 | $8,938 | $510,000 | $288,705 | $221,295 |
Source: Public Records
Map
Nearby Homes
- 1110 W Tri Oaks Ln Unit 157
- 1108 W Tri Oaks Ln Unit 150
- 13931 Kingsride Ln
- 11411 Ash Creek Dr
- 807 Patchester Dr
- 11402 Ash Creek Dr
- 1144 N Kirkwood Rd Unit 1144
- 710 Patchester Dr
- 1327 W Forest Dr
- 11731 Wickchester Ln
- 14122 Barryknoll Ln
- 11102 Savannah Oaks Ln
- 14151 Lost Meadow Ln
- 14143 Lost Meadow Ln
- 11116 Sherwood Oak Ln
- 1110 Oakwood Pass Ct
- 14123 Misty Meadow Ln
- 1307 Moorwick Ln
- 14213 Lost Meadow Ln
- 1113 Sherwood Trail
- 13827 Britoak Ln
- 13819 Britoak Ln
- 13818 Saint Marys Ln
- 13814 Saint Marys Ln
- 13831 Britoak Ln
- 13822 Saint Marys Ln
- 13810 Saint Marys Ln
- 13822 Britoak Ln
- 13826 Britoak Ln
- 13811 Britoak Ln
- 13835 Britoak Ln
- 13830 Britoak Ln
- 13806 Saint Marys Ln
- 13826 Saint Marys Ln
- 13814 Britoak Ln
- 13834 Britoak Ln
- 13839 Britoak Ln
- 13803 Britoak Ln
- 13810 Britoak Ln
- 13815 Saint Marys Ln