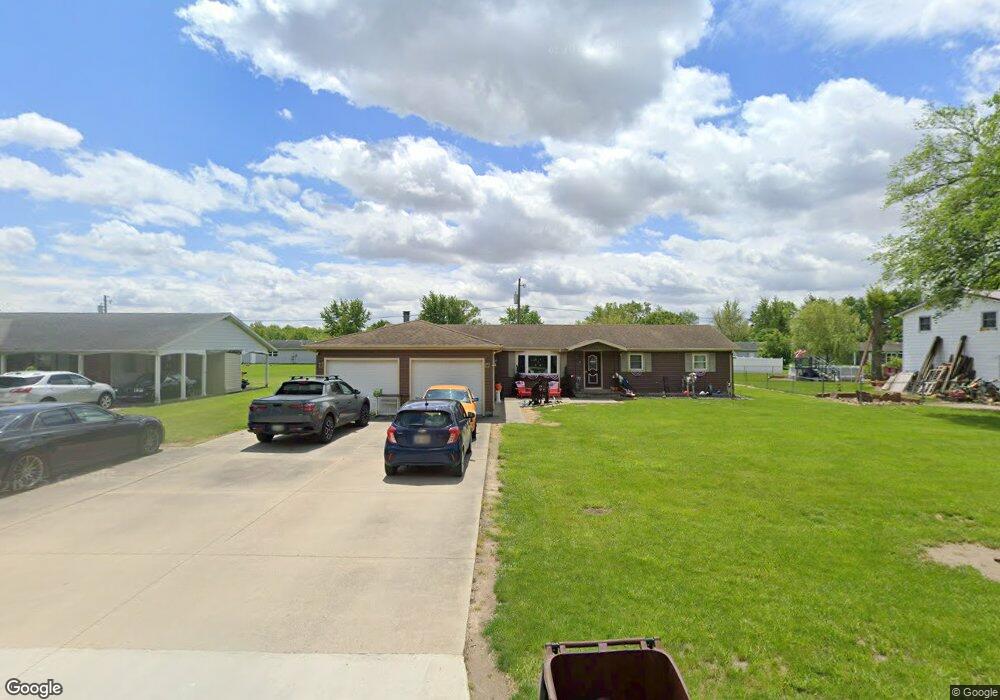
13824 Rita St Paulding, OH 45879
Estimated Value: $151,478 - $230,000
3
Beds
2
Baths
1,892
Sq Ft
$98/Sq Ft
Est. Value
About This Home
This home is located at 13824 Rita St, Paulding, OH 45879 and is currently estimated at $186,120, approximately $98 per square foot. 13824 Rita St is a home located in Paulding County with nearby schools including Paulding High School.
Ownership History
Date
Name
Owned For
Owner Type
Purchase Details
Closed on
Nov 24, 2008
Sold by
Bank Of New York
Bought by
Neer Rebecca S
Current Estimated Value
Home Financials for this Owner
Home Financials are based on the most recent Mortgage that was taken out on this home.
Original Mortgage
$42,655
Interest Rate
5.53%
Mortgage Type
Purchase Money Mortgage
Purchase Details
Closed on
Mar 4, 2008
Sold by
Carnahan Samuel and Carnahan Samuel Neal
Bought by
Bank Of New York
Purchase Details
Closed on
Dec 29, 2004
Sold by
Union Federal Bank Of Indianapolis
Bought by
Carnahan Samuel Neal and Carnahan Esther Eva
Home Financials for this Owner
Home Financials are based on the most recent Mortgage that was taken out on this home.
Original Mortgage
$85,600
Interest Rate
9.62%
Mortgage Type
Adjustable Rate Mortgage/ARM
Purchase Details
Closed on
Sep 25, 2003
Sold by
Glander Greg A
Bought by
Neer Rebecca S
Purchase Details
Closed on
Aug 30, 1999
Bought by
Neer Rebecca S
Create a Home Valuation Report for This Property
The Home Valuation Report is an in-depth analysis detailing your home's value as well as a comparison with similar homes in the area
Home Values in the Area
Average Home Value in this Area
Purchase History
| Date | Buyer | Sale Price | Title Company |
|---|---|---|---|
| Neer Rebecca S | $44,900 | Title First Agency Inc | |
| Bank Of New York | $52,000 | None Available | |
| Carnahan Samuel Neal | $85,700 | None Available | |
| Neer Rebecca S | -- | -- | |
| Neer Rebecca S | $85,000 | -- |
Source: Public Records
Mortgage History
| Date | Status | Borrower | Loan Amount |
|---|---|---|---|
| Previous Owner | Neer Rebecca S | $42,655 | |
| Previous Owner | Carnahan Samuel Neal | $85,600 |
Source: Public Records
Tax History
| Year | Tax Paid | Tax Assessment Tax Assessment Total Assessment is a certain percentage of the fair market value that is determined by local assessors to be the total taxable value of land and additions on the property. | Land | Improvement |
|---|---|---|---|---|
| 2025 | $1,852 | $52,470 | $8,510 | $43,960 |
| 2024 | $1,852 | $38,850 | $6,300 | $32,550 |
| 2023 | $1,306 | $38,850 | $6,300 | $32,550 |
| 2022 | $1,745 | $38,850 | $6,300 | $32,550 |
| 2021 | $1,398 | $27,860 | $5,670 | $22,190 |
| 2020 | $1,256 | $27,860 | $5,670 | $22,190 |
| 2019 | $1,266 | $26,810 | $5,670 | $21,140 |
| 2018 | $1,236 | $26,810 | $5,670 | $21,140 |
| 2017 | $1,237 | $26,810 | $5,670 | $21,140 |
| 2016 | $1,243 | $26,810 | $5,670 | $21,140 |
| 2015 | $1,303 | $28,530 | $6,300 | $22,230 |
| 2014 | $1,297 | $28,530 | $6,300 | $22,230 |
| 2013 | $1,404 | $28,530 | $6,300 | $22,230 |
Source: Public Records
Map
Nearby Homes
- 13688 Kay St
- 1065 Emerald Rd
- 741 Tom Tim Dr
- 780 N Williams St
- 830 N Walnut St
- 516 N Williams St
- 301 N Main St
- 406 N Cherry St
- 701 E Wayne St
- 215 N Dewitt St
- 742 E Perry St
- 614 W Jackson St
- 780 W Jackson St
- 520 W Wayne St
- 717 W Harrison St
- 714 W Wayne St
- 15010 U S 127
- 11051 Road 93
- 225 2nd St
- 17341 Road 139
Your Personal Tour Guide
Ask me questions while you tour the home.