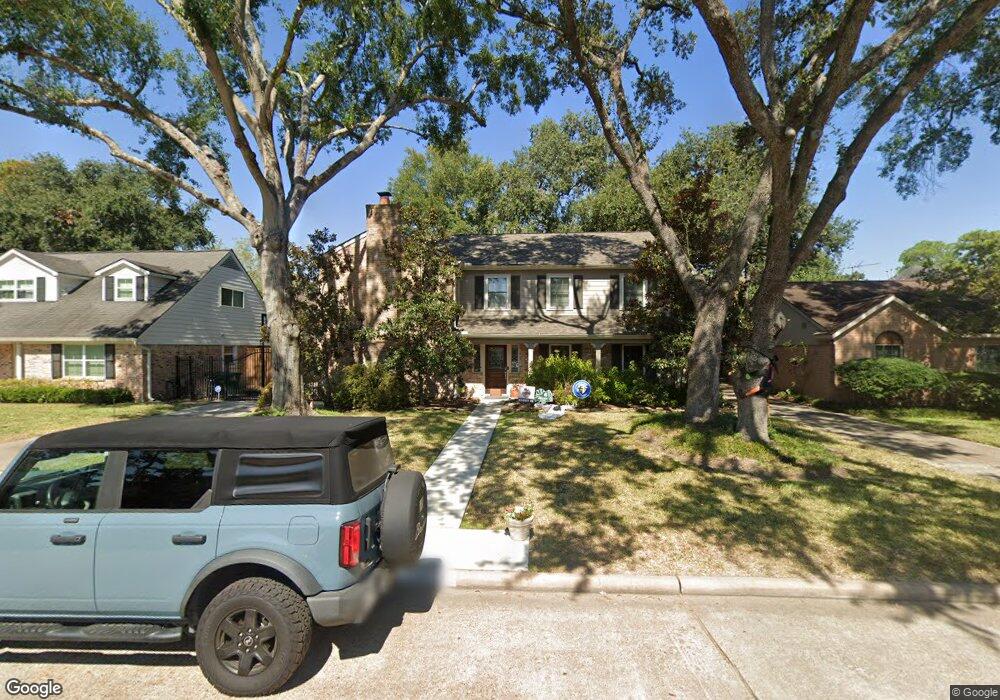
13826 Myrtlea Dr Unit 1 Houston, TX 77079
Memorial NeighborhoodEstimated Value: $718,000 - $901,000
4
Beds
3
Baths
2,656
Sq Ft
$312/Sq Ft
Est. Value
About This Home
This home is located at 13826 Myrtlea Dr Unit 1, Houston, TX 77079 and is currently estimated at $828,222, approximately $311 per square foot. 13826 Myrtlea Dr Unit 1 is a home located in Harris County with nearby schools including Wilchester Elementary School, Memorial Middle, and Stratford High School.
Ownership History
Date
Name
Owned For
Owner Type
Purchase Details
Closed on
Nov 12, 2010
Sold by
Ebel Steven and Ebel Sonja R
Bought by
Hughes Gregory J and Kristensen Mette B
Current Estimated Value
Home Financials for this Owner
Home Financials are based on the most recent Mortgage that was taken out on this home.
Original Mortgage
$337,000
Outstanding Balance
$5,067
Interest Rate
4.32%
Mortgage Type
New Conventional
Estimated Equity
$823,155
Purchase Details
Closed on
Nov 21, 2003
Sold by
Su Ta Shen and Su Amy H
Bought by
Ebel Steven and Ebel Sonja R
Home Financials for this Owner
Home Financials are based on the most recent Mortgage that was taken out on this home.
Original Mortgage
$168,800
Interest Rate
5.93%
Mortgage Type
Purchase Money Mortgage
Create a Home Valuation Report for This Property
The Home Valuation Report is an in-depth analysis detailing your home's value as well as a comparison with similar homes in the area
Home Values in the Area
Average Home Value in this Area
Purchase History
| Date | Buyer | Sale Price | Title Company |
|---|---|---|---|
| Hughes Gregory J | -- | First American Title | |
| Ebel Steven | -- | Texas American Title Company |
Source: Public Records
Mortgage History
| Date | Status | Borrower | Loan Amount |
|---|---|---|---|
| Open | Hughes Gregory J | $337,000 | |
| Previous Owner | Ebel Steven | $168,800 | |
| Closed | Ebel Steven | $31,650 |
Source: Public Records
Tax History Compared to Growth
Tax History
| Year | Tax Paid | Tax Assessment Tax Assessment Total Assessment is a certain percentage of the fair market value that is determined by local assessors to be the total taxable value of land and additions on the property. | Land | Improvement |
|---|---|---|---|---|
| 2025 | $10,413 | $827,400 | $408,980 | $418,420 |
| 2024 | $10,413 | $651,543 | $408,980 | $242,563 |
| 2023 | $10,413 | $688,600 | $408,980 | $279,620 |
| 2022 | $16,833 | $720,000 | $371,800 | $348,200 |
| 2021 | $17,113 | $724,919 | $334,620 | $390,299 |
| 2020 | $15,966 | $637,224 | $334,620 | $302,604 |
| 2019 | $17,619 | $673,000 | $334,620 | $338,380 |
| 2018 | $6,239 | $637,388 | $334,620 | $302,768 |
| 2017 | $16,675 | $637,388 | $334,620 | $302,768 |
| 2016 | $15,612 | $596,770 | $334,620 | $262,150 |
| 2015 | $10,558 | $653,000 | $334,620 | $318,380 |
| 2014 | $10,558 | $577,884 | $282,568 | $295,316 |
Source: Public Records
Map
Nearby Homes
- 13931 Kingsride Ln
- 807 Patchester Dr
- 710 Patchester Dr
- 1110 W Tri Oaks Ln Unit 157
- 14122 Barryknoll Ln
- 1108 W Tri Oaks Ln Unit 150
- 14123 Misty Meadow Ln
- 11411 Ash Creek Dr
- 14143 Lost Meadow Ln
- 14151 Lost Meadow Ln
- 14135 Kimberley Ln
- 11402 Ash Creek Dr
- 1144 N Kirkwood Rd Unit 1144
- 14226 Misty Meadow Ln
- 14228 Misty Meadow Ln
- 14171 Misty Meadow Ln
- 14213 Lost Meadow Ln
- 11731 Wickchester Ln
- 14325 Lost Meadow Ln
- 1327 W Forest Dr
- 13826 Myrtlea Dr
- 13830 Myrtlea Dr
- 13822 Myrtlea Dr
- 13831 Saint Marys Ln
- 13827 Saint Marys Ln
- 13834 Myrtlea Dr
- 13818 Myrtlea Dr
- 13835 Saint Marys Ln
- 13823 Saint Marys Ln
- 13823 Myrtlea Dr
- 13827 Myrtlea Dr
- 13819 Myrtlea Dr
- 13819 Saint Marys Ln
- 13831 Myrtlea Dr
- 13819 St Marys
- 13903 Saint Marys Ln
- 13814 Myrtlea Dr
- 13815 Myrtlea Dr
- 13835 Myrtlea Dr
- 13815 Saint Marys Ln