Estimated Value: $169,000 - $225,000
4
Beds
1
Bath
1,234
Sq Ft
$160/Sq Ft
Est. Value
About This Home
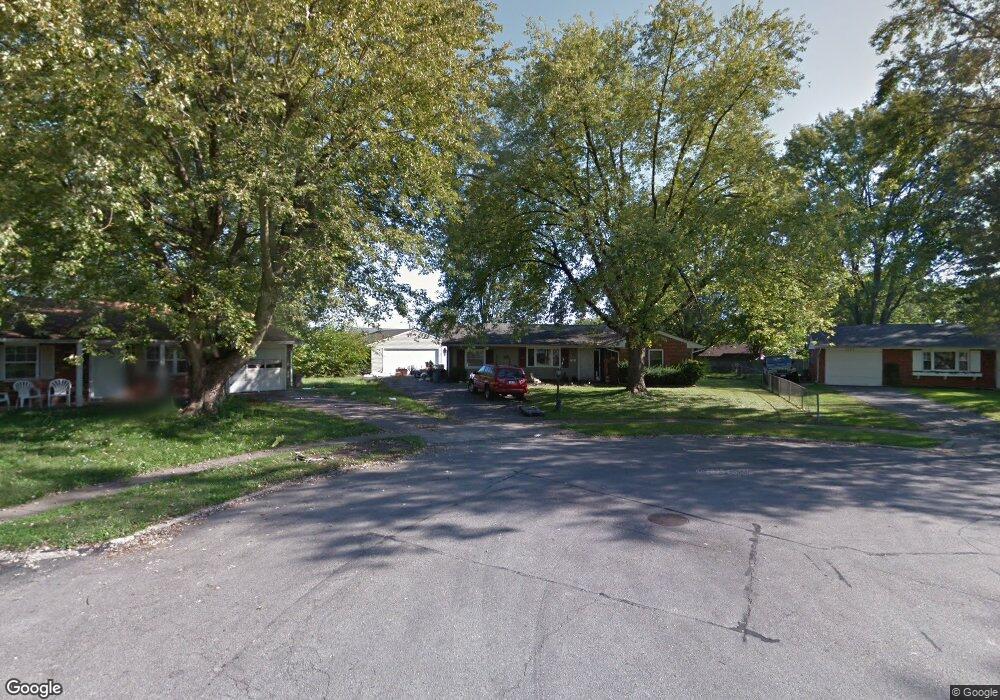
This home is located at 1383 Chinook Ct, Xenia, OH 45385 and is currently estimated at $197,569, approximately $160 per square foot. 1383 Chinook Ct is a home located in Greene County with nearby schools including Xenia High School, Summit Academy Community School for Alternative Learners - Xenia, and Legacy Christian Academy.
Ownership History
Date
Name
Owned For
Owner Type
Purchase Details
Closed on
Aug 2, 2013
Sold by
Chaney Debra J
Bought by
Ohio Valley Property Management Llc
Current Estimated Value
Purchase Details
Closed on
Dec 21, 2000
Sold by
Matthew Webster William and Matthew Lisa
Bought by
Chaney Debra J
Home Financials for this Owner
Home Financials are based on the most recent Mortgage that was taken out on this home.
Original Mortgage
$97,850
Interest Rate
6.95%
Mortgage Type
VA
Purchase Details
Closed on
May 29, 1998
Sold by
Woods Darrell L and Woods Constance S
Bought by
Webster William Matthew
Home Financials for this Owner
Home Financials are based on the most recent Mortgage that was taken out on this home.
Original Mortgage
$62,800
Interest Rate
7.32%
Purchase Details
Closed on
May 20, 1997
Sold by
Dutton Pete
Bought by
Woods Darrell L
Create a Home Valuation Report for This Property
The Home Valuation Report is an in-depth analysis detailing your home's value as well as a comparison with similar homes in the area
Home Values in the Area
Average Home Value in this Area
Purchase History
| Date | Buyer | Sale Price | Title Company |
|---|---|---|---|
| Ohio Valley Property Management Llc | $35,000 | None Available | |
| Chaney Debra J | $95,000 | -- | |
| Webster William Matthew | $78,500 | -- | |
| Woods Darrell L | $78,200 | -- | |
| Woods Darrell L | $78,118 | -- |
Source: Public Records
Mortgage History
| Date | Status | Borrower | Loan Amount |
|---|---|---|---|
| Previous Owner | Chaney Debra J | $97,850 | |
| Previous Owner | Webster William Matthew | $62,800 | |
| Closed | Woods Darrell L | $0 |
Source: Public Records
Tax History Compared to Growth
Tax History
| Year | Tax Paid | Tax Assessment Tax Assessment Total Assessment is a certain percentage of the fair market value that is determined by local assessors to be the total taxable value of land and additions on the property. | Land | Improvement |
|---|---|---|---|---|
| 2024 | $2,046 | $47,820 | $11,570 | $36,250 |
| 2023 | $2,046 | $47,820 | $11,570 | $36,250 |
| 2022 | $1,736 | $34,600 | $6,800 | $27,800 |
| 2021 | $1,759 | $34,600 | $6,800 | $27,800 |
| 2020 | $1,685 | $34,600 | $6,800 | $27,800 |
| 2019 | $1,490 | $28,790 | $6,530 | $22,260 |
| 2018 | $1,496 | $28,790 | $6,530 | $22,260 |
| 2017 | $1,452 | $28,790 | $6,530 | $22,260 |
| 2016 | $1,386 | $26,180 | $6,530 | $19,650 |
| 2015 | $1,390 | $26,180 | $6,530 | $19,650 |
| 2014 | $1,331 | $26,180 | $6,530 | $19,650 |
Source: Public Records
Map
Nearby Homes
- 1618 Navajo Dr
- 1568 Cheyenne Dr
- 1144 Rockwell Dr
- 1653 Seneca Dr
- 1778 Arapaho Dr
- 1208 Bellbrook Ave
- 1272 Bellbrook Ave
- 1342 Kylemore Dr
- 1769 Gayhart Dr
- 2758 Wyoming Dr
- 161 Montana Dr
- 1829 Gayhart Dr
- 121 S Progress Dr
- 1391 June Dr
- 1283 June Dr
- 219 Kansas Dr
- 1233 June Dr
- 1866 Roxbury Dr
- 1223 June Dr
- 1908 Whitt St
- 1397 Chinook Ct
- 1378 Chinook Ct
- 1466 Souix Dr
- 1466 Sioux Dr
- 1452 Sioux Dr
- 1540 Crockett Ct
- 1552 Crockett Ct
- 1480 Sioux Dr
- 1409 Chinook Ct
- 1438 Sioux Dr
- 1392 Chinook Ct
- 1494 Sioux Dr
- 1424 Sioux Dr
- 1566 Crockett Ct
- 1406 Chinook Ct
- 1463 Navajo Dr
- 1477 Navajo Dr
- 1420 Chinook Ct
- 1410 Sioux Dr
- 1491 Navajo Dr