Estimated Value: $410,000 - $501,000
4
Beds
3
Baths
2,194
Sq Ft
$205/Sq Ft
Est. Value
About This Home
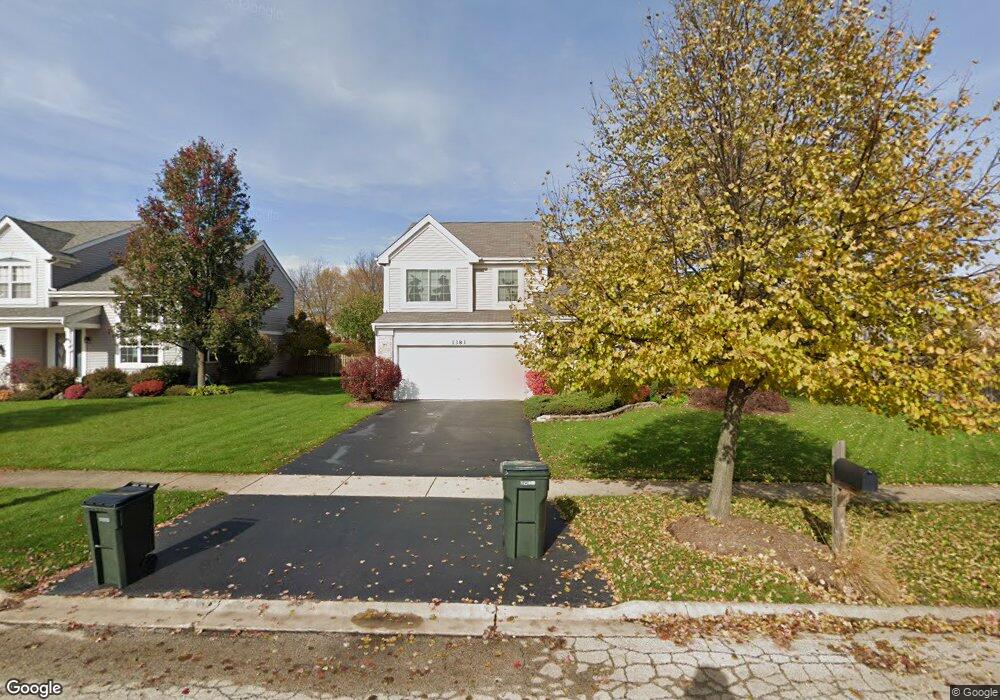
This home is located at 1383 Collins Dr, Cary, IL 60013 and is currently estimated at $450,507, approximately $205 per square foot. 1383 Collins Dr is a home located in McHenry County with nearby schools including Canterbury Elementary School, Hannah Beardsley Middle School, and Prairie Ridge High School.
Ownership History
Date
Name
Owned For
Owner Type
Purchase Details
Closed on
Sep 12, 2019
Sold by
Kluge Jason P and Goffron Kluge Joy H
Bought by
Kluge Jason Paul and Goffron Kluge Joy Helen
Current Estimated Value
Purchase Details
Closed on
Feb 17, 2007
Sold by
Wehmhoefer Mark C and Wehmhoefer Mary E
Bought by
Kluge Jason P and Kluge Joy Goffron
Home Financials for this Owner
Home Financials are based on the most recent Mortgage that was taken out on this home.
Original Mortgage
$46,500
Outstanding Balance
$28,037
Interest Rate
6.28%
Mortgage Type
Unknown
Estimated Equity
$422,470
Purchase Details
Closed on
Feb 1, 2002
Sold by
Cambria Llc
Bought by
Ehmhoefer Mark C and Wehmhoefer Mary E
Home Financials for this Owner
Home Financials are based on the most recent Mortgage that was taken out on this home.
Original Mortgage
$150,000
Interest Rate
7.23%
Create a Home Valuation Report for This Property
The Home Valuation Report is an in-depth analysis detailing your home's value as well as a comparison with similar homes in the area
Home Values in the Area
Average Home Value in this Area
Purchase History
| Date | Buyer | Sale Price | Title Company |
|---|---|---|---|
| Kluge Jason Paul | -- | None Available | |
| Kluge Jason P | $310,000 | Republic Title Company | |
| Ehmhoefer Mark C | $251,500 | Ticor Title Insurance Compan |
Source: Public Records
Mortgage History
| Date | Status | Borrower | Loan Amount |
|---|---|---|---|
| Open | Kluge Jason P | $46,500 | |
| Previous Owner | Ehmhoefer Mark C | $150,000 |
Source: Public Records
Tax History
| Year | Tax Paid | Tax Assessment Tax Assessment Total Assessment is a certain percentage of the fair market value that is determined by local assessors to be the total taxable value of land and additions on the property. | Land | Improvement |
|---|---|---|---|---|
| 2024 | $11,575 | $121,296 | $25,089 | $96,207 |
| 2023 | $11,206 | $108,484 | $22,439 | $86,045 |
| 2022 | $11,873 | $110,274 | $34,410 | $75,864 |
| 2021 | $11,304 | $102,733 | $32,057 | $70,676 |
| 2020 | $11,023 | $99,096 | $30,922 | $68,174 |
| 2019 | $10,655 | $94,847 | $29,596 | $65,251 |
| 2018 | $10,057 | $87,618 | $27,340 | $60,278 |
| 2017 | $10,015 | $82,542 | $25,756 | $56,786 |
| 2016 | $9,910 | $77,417 | $24,157 | $53,260 |
| 2013 | -- | $71,655 | $22,535 | $49,120 |
Source: Public Records
Map
Nearby Homes
- 1259 Chickory Ridge Trail
- 3712 3 Oaks Rd
- 29 Ivanhoe Ln
- 0 Kaper Dr
- 600 Hillcrest Ln
- 800 Big Bear Trail
- +/-5.72 Acres S Illinois Route 31
- 1150 Amber Dr
- 1145 Amber Dr
- 4801 Rose St
- 1141 Westlake Dr
- 413 Haber Rd Unit 5
- 417 Haber Rd Unit 6
- 421 Haber Rd Unit 7
- 425 Haber Rd Unit 6
- 515 Surrey Ridge Dr
- 256 Haber Ct
- 550 Enclave Dr
- 1293 W Lake Dr
- 794 Pointe Dr Unit 11
- 1389 Collins Dr
- 1364 Geneva Ln
- 1395 Collins Dr
- 1388 Collins Dr
- 1394 Collins Dr
- 1348 Geneva Ln
- 1382 Collins Dr
- 1405 New Haven Dr
- 1421 New Haven Dr
- 1413 New Haven Dr
- 1415 New Haven Dr
- 1407 New Haven Dr
- 1417 New Haven Dr
- 1419 New Haven Dr
- 1409 New Haven Dr
- 1411 New Haven Dr
- 1401 New Haven Dr
- 1407 New Haven Dr Unit 1407
- 1415 New Haven Dr Unit 1415
- 1400 Collins Dr
Your Personal Tour Guide
Ask me questions while you tour the home.