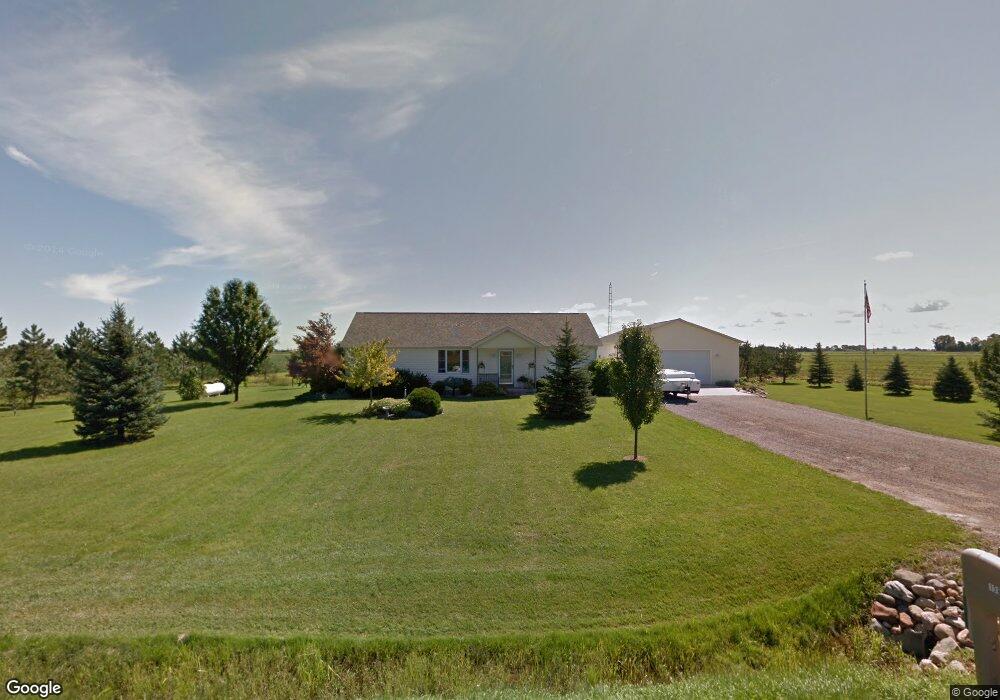
1383 S Farley Rd Munger, MI 48747
Estimated Value: $202,000 - $267,285
3
Beds
2
Baths
1,456
Sq Ft
$163/Sq Ft
Est. Value
About This Home
This home is located at 1383 S Farley Rd, Munger, MI 48747 and is currently estimated at $236,821, approximately $162 per square foot. 1383 S Farley Rd is a home located in Bay County with nearby schools including Hampton Elementary School, Handy Middle School, and Bay City Central High School.
Ownership History
Date
Name
Owned For
Owner Type
Purchase Details
Closed on
Dec 13, 2011
Sold by
Hopp Vernor D and Hopp Connie A
Bought by
Hopp John D and Hopp Tammy
Current Estimated Value
Purchase Details
Closed on
Mar 11, 1999
Bought by
Hopp John D and Hopp Tammy
Create a Home Valuation Report for This Property
The Home Valuation Report is an in-depth analysis detailing your home's value as well as a comparison with similar homes in the area
Home Values in the Area
Average Home Value in this Area
Purchase History
| Date | Buyer | Sale Price | Title Company |
|---|---|---|---|
| Hopp John D | -- | None Available | |
| Hopp John D | -- | -- |
Source: Public Records
Tax History Compared to Growth
Tax History
| Year | Tax Paid | Tax Assessment Tax Assessment Total Assessment is a certain percentage of the fair market value that is determined by local assessors to be the total taxable value of land and additions on the property. | Land | Improvement |
|---|---|---|---|---|
| 2025 | $2,958 | $144,650 | $0 | $0 |
| 2024 | $1,434 | $129,200 | $0 | $0 |
| 2023 | $1,365 | $109,000 | $0 | $0 |
| 2022 | $2,689 | $109,100 | $0 | $0 |
| 2021 | $2,484 | $100,050 | $100,050 | $0 |
| 2020 | $2,431 | $75,200 | $75,200 | $0 |
| 2019 | $2,375 | $75,050 | $0 | $0 |
| 2018 | $2,309 | $70,850 | $0 | $0 |
| 2017 | $2,435 | $75,450 | $0 | $0 |
| 2016 | $2,440 | $81,350 | $14,000 | $67,350 |
| 2015 | $2,427 | $74,300 | $14,000 | $60,300 |
| 2014 | $2,427 | $76,550 | $13,700 | $62,850 |
Source: Public Records
Map
Nearby Homes
- VL Madajski Rd
- 1495 S Knight Rd
- 2165 S Tuscola Rd
- 2239 S Tuscola Rd
- 0 W German Rd
- 80 Burns Rd
- 0 W Munger Rd
- 7977 N Portsmouth Rd
- 3177 N Van Buren Rd
- 3705 N Beyer Rd
- 1026 N Farley Rd
- 743 N Jones Rd
- 1599 S Reese Rd
- 568 W Center Rd
- 1643 Farm Ln
- 929 Underwood Ln
- 1056 W Center Rd
- 1668 Ashwood Dr
- 1043 Rosemary Ct
- 1030 Culver Rd
- 0 Munger Rd Unit 2101519
- 1449 S Farley Rd
- 1485 S Farley Rd
- 494 E Munger Rd
- 431 E Munger Rd
- 512 E Munger Rd
- 464 E Munger Rd
- 00 Munger Rd W
- 448 E Munger Rd
- 436 E Munger Rd
- 1230 S Farley Rd
- 424 E Munger Rd
- 424 E Munger Rd
- 359 E Munger Rd
- 348 E Munger Rd
- 321 E Munger Rd
- 721 E Munger Rd
- 301 E Munger Rd
- 298 E Munger Rd
- 1363 S Callahan Rd