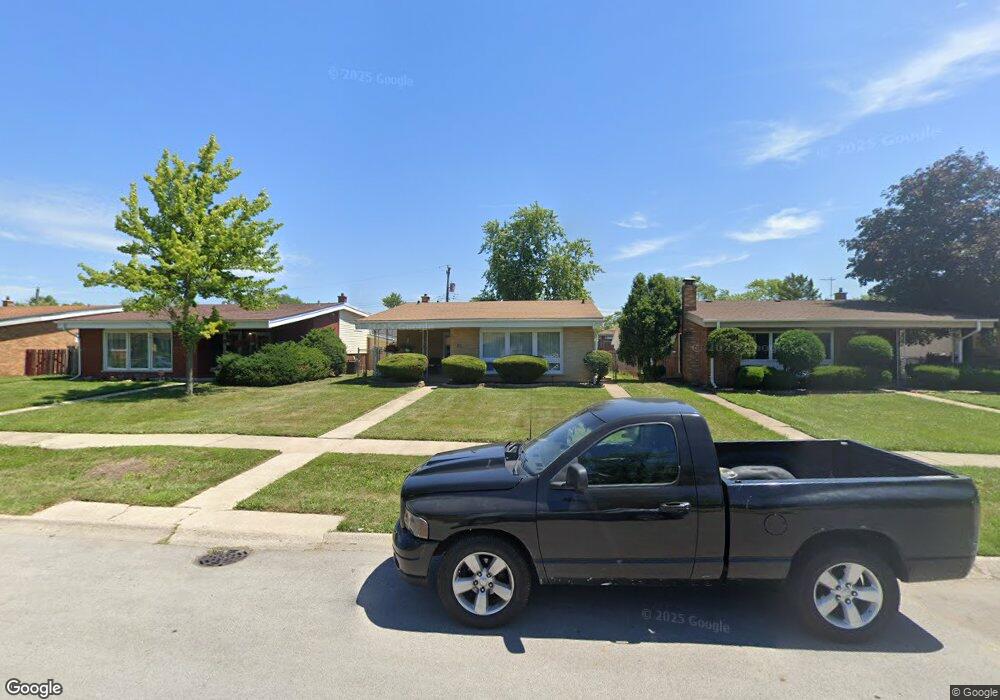
1383 Superior Ave Calumet City, IL 60409
Estimated Value: $185,000 - $230,000
4
Beds
3
Baths
1,672
Sq Ft
$122/Sq Ft
Est. Value
About This Home
This home is located at 1383 Superior Ave, Calumet City, IL 60409 and is currently estimated at $203,977, approximately $121 per square foot. 1383 Superior Ave is a home located in Cook County with nearby schools including Hoover Elementary School, Schrum Memorial Middle School, and Thornton Fractional North High School.
Ownership History
Date
Name
Owned For
Owner Type
Purchase Details
Closed on
Nov 18, 2003
Sold by
Mcneal James H
Bought by
Newell Nicole
Current Estimated Value
Home Financials for this Owner
Home Financials are based on the most recent Mortgage that was taken out on this home.
Original Mortgage
$128,000
Outstanding Balance
$61,762
Interest Rate
6.59%
Mortgage Type
Unknown
Estimated Equity
$142,215
Purchase Details
Closed on
Jun 2, 1997
Sold by
Lukasik Florence and Lukasik John J
Bought by
Mcneal James H
Home Financials for this Owner
Home Financials are based on the most recent Mortgage that was taken out on this home.
Original Mortgage
$89,000
Interest Rate
8%
Mortgage Type
FHA
Purchase Details
Closed on
Oct 14, 1995
Sold by
Lukasik Florence
Bought by
Lukasik Florence and Nowak Darlene
Create a Home Valuation Report for This Property
The Home Valuation Report is an in-depth analysis detailing your home's value as well as a comparison with similar homes in the area
Home Values in the Area
Average Home Value in this Area
Purchase History
| Date | Buyer | Sale Price | Title Company |
|---|---|---|---|
| Newell Nicole | $128,000 | Multiple | |
| Mcneal James H | $89,500 | -- | |
| Lukasik Florence | -- | -- |
Source: Public Records
Mortgage History
| Date | Status | Borrower | Loan Amount |
|---|---|---|---|
| Open | Newell Nicole | $128,000 | |
| Previous Owner | Mcneal James H | $89,000 |
Source: Public Records
Tax History Compared to Growth
Tax History
| Year | Tax Paid | Tax Assessment Tax Assessment Total Assessment is a certain percentage of the fair market value that is determined by local assessors to be the total taxable value of land and additions on the property. | Land | Improvement |
|---|---|---|---|---|
| 2024 | $7,014 | $13,982 | $2,529 | $11,453 |
| 2023 | $6,479 | $15,000 | $2,529 | $12,471 |
| 2022 | $6,479 | $11,020 | $2,231 | $8,789 |
| 2021 | $6,433 | $11,019 | $2,231 | $8,788 |
| 2020 | $5,595 | $11,019 | $2,231 | $8,788 |
| 2019 | $6,070 | $11,593 | $2,082 | $9,511 |
| 2018 | $6,103 | $11,593 | $2,082 | $9,511 |
| 2017 | $5,839 | $11,593 | $2,082 | $9,511 |
| 2016 | $5,179 | $10,182 | $1,933 | $8,249 |
| 2015 | $5,018 | $10,182 | $1,933 | $8,249 |
| 2014 | $4,861 | $10,182 | $1,933 | $8,249 |
| 2013 | $5,195 | $11,425 | $1,933 | $9,492 |
Source: Public Records
Map
Nearby Homes
- 1365 Imperial Ave
- 1367 Buffalo Ave
- 1383 Greenbay Ave
- 1317 Mackinaw Ave
- 1287 Arthur St
- 1404 Burnham Ave
- 1290 Balmoral Ave
- 1421 Burnham Ave
- 1295 Greenbay Ave
- 1354 Hirsch Ave
- 1433 Burnham Ave
- 1261 Balmoral Ave
- 1278 Balmoral Ave
- 1262 Greenbay Ave
- 1455 Burnham Ave
- 1322 River Dr
- 1272 Burnham Ave
- 1366 Price Ave
- 1229 Arthur St
- 1295 Hirsch Ave
- 1379 Superior Ave
- 1387 Superior Ave
- 1375 Superior Ave
- 1391 Superior Ave
- 1382 Buffalo Ave
- 1386 Buffalo Ave
- 1378 Buffalo Ave
- 1395 Superior Ave
- 1371 Superior Ave
- 800 163rd St
- 1374 Buffalo Ave
- 1392 Buffalo Ave
- 1367 Superior Ave
- 1396 Buffalo Ave
- 1370 Buffalo Ave
- 801 163rd St
- 1390 Superior Ave
- 808 163rd St
- 1366 Buffalo Ave
- 1386 Superior Ave