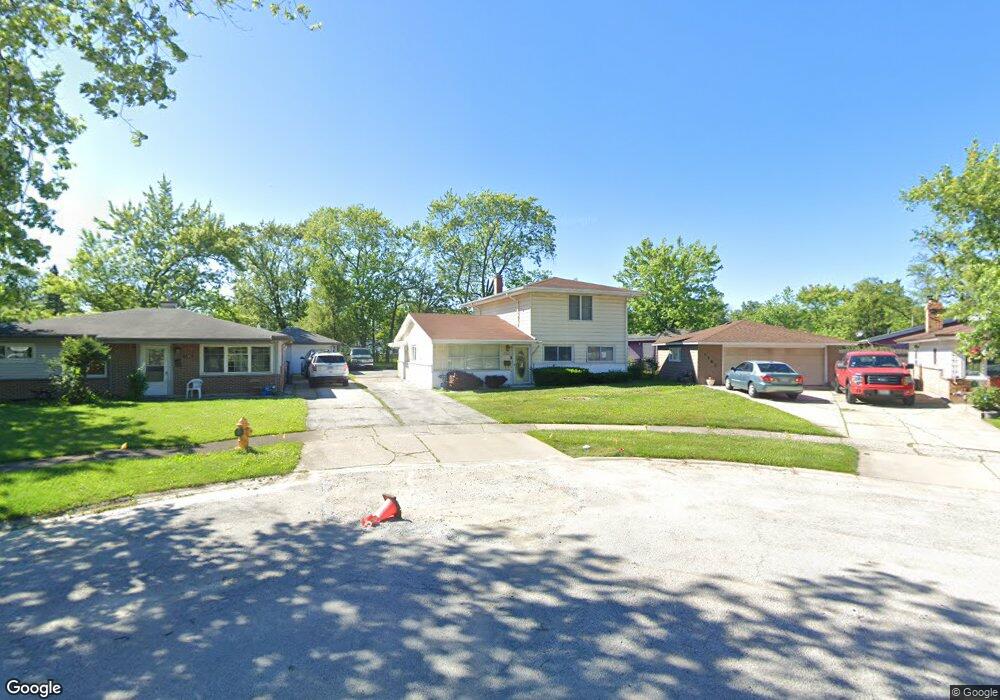
1384 Forest Ave Calumet City, IL 60409
Estimated Value: $189,600 - $253,000
4
Beds
2
Baths
1,736
Sq Ft
$119/Sq Ft
Est. Value
About This Home
This home is located at 1384 Forest Ave, Calumet City, IL 60409 and is currently estimated at $206,150, approximately $118 per square foot. 1384 Forest Ave is a home located in Cook County with nearby schools including Hoover Elementary School, Schrum Memorial Middle School, and Thornton Fractional North High School.
Ownership History
Date
Name
Owned For
Owner Type
Purchase Details
Closed on
Mar 16, 2023
Sold by
Stuckey Christopher and Stuckey Garnadette
Bought by
Chicago Title Land Trust Company
Current Estimated Value
Purchase Details
Closed on
Oct 28, 2007
Sold by
Collins Terrell and Collins Frances V
Bought by
Stuckey Christopher
Home Financials for this Owner
Home Financials are based on the most recent Mortgage that was taken out on this home.
Original Mortgage
$150,000
Interest Rate
6.38%
Mortgage Type
Unknown
Purchase Details
Closed on
Dec 12, 2003
Sold by
Watkins Sherrell A
Bought by
Collins Terrell and Collins Frances V
Purchase Details
Closed on
Mar 19, 1999
Sold by
King John M and King Rebecca J
Bought by
Watkins Sherrell A
Home Financials for this Owner
Home Financials are based on the most recent Mortgage that was taken out on this home.
Original Mortgage
$94,325
Interest Rate
6.85%
Mortgage Type
FHA
Create a Home Valuation Report for This Property
The Home Valuation Report is an in-depth analysis detailing your home's value as well as a comparison with similar homes in the area
Home Values in the Area
Average Home Value in this Area
Purchase History
| Date | Buyer | Sale Price | Title Company |
|---|---|---|---|
| Chicago Title Land Trust Company | -- | Chicago Title | |
| Stuckey Christopher | $150,000 | Multiple | |
| Collins Terrell | $120,000 | Pntn | |
| Watkins Sherrell A | $94,500 | Chicago Title Insurance Co |
Source: Public Records
Mortgage History
| Date | Status | Borrower | Loan Amount |
|---|---|---|---|
| Previous Owner | Stuckey Christopher | $150,000 | |
| Previous Owner | Watkins Sherrell A | $94,325 |
Source: Public Records
Tax History Compared to Growth
Tax History
| Year | Tax Paid | Tax Assessment Tax Assessment Total Assessment is a certain percentage of the fair market value that is determined by local assessors to be the total taxable value of land and additions on the property. | Land | Improvement |
|---|---|---|---|---|
| 2024 | $8,341 | $16,000 | $2,978 | $13,022 |
| 2023 | $6,398 | $16,000 | $2,978 | $13,022 |
| 2022 | $6,398 | $10,924 | $2,627 | $8,297 |
| 2021 | $6,353 | $10,924 | $2,627 | $8,297 |
| 2020 | $5,527 | $10,924 | $2,627 | $8,297 |
| 2019 | $6,461 | $12,119 | $2,452 | $9,667 |
| 2018 | $6,497 | $12,119 | $2,452 | $9,667 |
| 2017 | $6,213 | $12,119 | $2,452 | $9,667 |
| 2016 | $5,454 | $10,590 | $2,276 | $8,314 |
| 2015 | $5,289 | $10,590 | $2,276 | $8,314 |
| 2014 | $5,122 | $10,590 | $2,276 | $8,314 |
| 2013 | $5,241 | $11,502 | $2,276 | $9,226 |
Source: Public Records
Map
Nearby Homes
- 1375 Forest Place
- 1373 Stanley Blvd
- 1404 Wentworth Ave Unit 1
- 1420 Wentworth Ave
- 1395 Freeland Ave
- 1374 Kenilworth Dr
- 1351 Gordon Ave
- 107 163rd St
- 1341 Gordon Ave
- 1461 Wentworth Ave
- 1481 Lincoln Ave
- 43 163rd St
- 1473 Wentworth Ave
- 1304 Freeland Ave
- 1387 Price Ave
- 1313 Gordon Ave
- 1481 Lincoln Place
- 1490 Lincoln Ave
- 1464 Shirley Dr
- 1366 Price Ave
- 1386 Forest Ave
- 1382 Forest Ave
- 1364 Forest Ave
- 1376 Forest Ave
- 1370 Forest Ave
- 1381 Forest Place
- 1360 Forest Ave
- 1369 Forest Place
- 1387 Forest Place
- 1365 Forest Place
- 1392 Forest Ave
- 1394 Forest Ave
- 1393 Forest Place
- 1399 Forest Place
- 1400 Forest Ave
- 1383 Forest Ave
- 1379 Forest Ave
- 1387 Forest Ave Unit 2
- 1375 Forest Ave
- 1359 Forest Ave