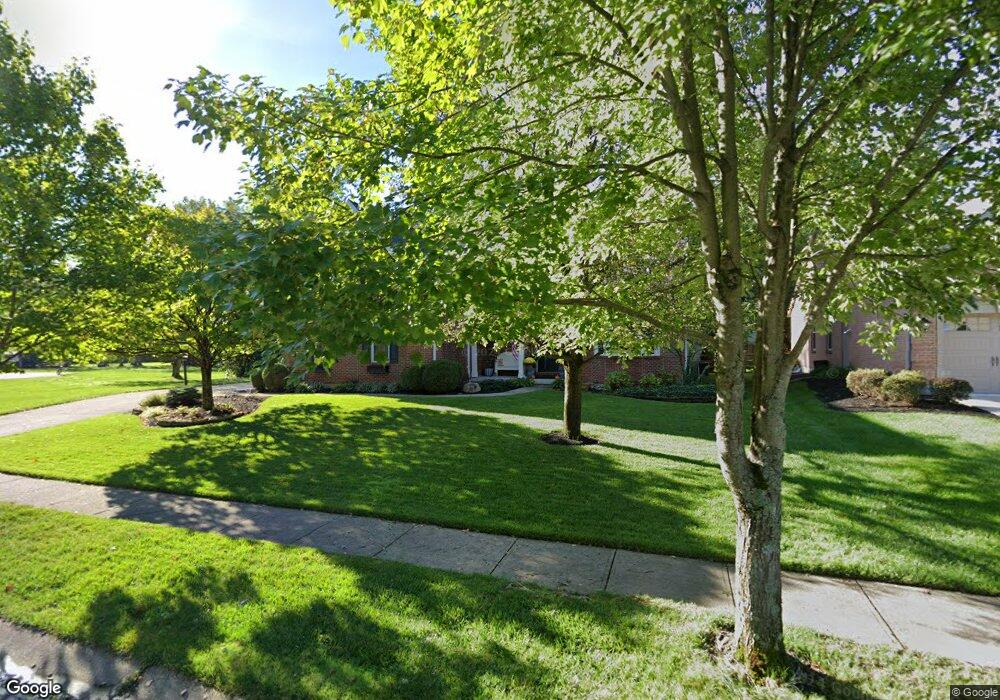
1384 Thornbird Dr Cincinnati, OH 45230
Mount Washington NeighborhoodEstimated Value: $711,000 - $945,000
4
Beds
4
Baths
4,109
Sq Ft
$195/Sq Ft
Est. Value
About This Home
This home is located at 1384 Thornbird Dr, Cincinnati, OH 45230 and is currently estimated at $800,415, approximately $194 per square foot. 1384 Thornbird Dr is a home located in Hamilton County with nearby schools including Mt. Washington Elementary School, Clark Montessori High School, and Shroder High School.
Ownership History
Date
Name
Owned For
Owner Type
Purchase Details
Closed on
Jun 27, 2001
Sold by
Matre James A
Bought by
Veeneman Michael J and Veeneman Karen Y
Current Estimated Value
Home Financials for this Owner
Home Financials are based on the most recent Mortgage that was taken out on this home.
Original Mortgage
$239,000
Outstanding Balance
$87,234
Interest Rate
7.22%
Estimated Equity
$713,181
Purchase Details
Closed on
Nov 30, 1999
Sold by
Atrium Marketing Services Inc
Bought by
Olh Ltd
Home Financials for this Owner
Home Financials are based on the most recent Mortgage that was taken out on this home.
Original Mortgage
$42,600
Interest Rate
7.7%
Create a Home Valuation Report for This Property
The Home Valuation Report is an in-depth analysis detailing your home's value as well as a comparison with similar homes in the area
Home Values in the Area
Average Home Value in this Area
Purchase History
| Date | Buyer | Sale Price | Title Company |
|---|---|---|---|
| Veeneman Michael J | -- | -- | |
| Matre James A | $404,300 | -- | |
| Olh Ltd | $53,300 | -- |
Source: Public Records
Mortgage History
| Date | Status | Borrower | Loan Amount |
|---|---|---|---|
| Open | Veeneman Michael J | $239,000 | |
| Previous Owner | Olh Ltd | $42,600 |
Source: Public Records
Tax History
| Year | Tax Paid | Tax Assessment Tax Assessment Total Assessment is a certain percentage of the fair market value that is determined by local assessors to be the total taxable value of land and additions on the property. | Land | Improvement |
|---|---|---|---|---|
| 2025 | $14,182 | $229,940 | $20,790 | $209,150 |
| 2024 | $13,779 | $229,940 | $20,790 | $209,150 |
| 2023 | $14,070 | $229,940 | $20,790 | $209,150 |
| 2022 | $12,775 | $187,303 | $23,940 | $163,363 |
| 2021 | $12,313 | $187,303 | $23,940 | $163,363 |
| 2020 | $12,653 | $187,303 | $23,940 | $163,363 |
| 2019 | $12,147 | $164,301 | $21,000 | $143,301 |
| 2018 | $12,165 | $164,301 | $21,000 | $143,301 |
| 2017 | $11,568 | $164,301 | $21,000 | $143,301 |
| 2016 | $12,368 | $173,156 | $21,000 | $152,156 |
| 2015 | $11,144 | $173,156 | $21,000 | $152,156 |
| 2014 | $11,222 | $173,156 | $21,000 | $152,156 |
| 2013 | $11,417 | $173,156 | $21,000 | $152,156 |
Source: Public Records
Map
Nearby Homes
- 1341 Mayland Dr
- 6952 Shadow Ridge Rd
- 1319 Schirmer Ave
- 1508 Beth Ln
- 6168 Thole Rd
- 1 Salem Rd
- 6201 Thole Rd
- a Salem Rd
- 6381 Beaconwood Dr
- 6123 Cambridge Ave
- 3 Salem Rd
- 2 Salem Rd
- 4 Salem Rd
- 1741 Mears Ave
- 6604 Ambar Ave
- 1361 Bursal Ave
- 1305 Bursal Ave
- 1139 Birney Ln
- 1190 Linden Hill Ln
- 1184 Linden Hill Ln
- 1380 Thornbird Dr
- 1376 Thornbird Dr
- 1392 Thornbird Dr
- 6188 Woodlark Dr
- 6184 Woodlark Dr
- 6218 Woodlark Dr
- 1383 Thornbird Dr
- 1379 Thornbird Dr
- 6182 Woodlark Dr
- 1372 Thornbird Dr
- 6224 Woodlark Dr
- 1375 Thornbird Dr
- 1387 Thornbird Dr
- 1391 Thornbird Dr
- 1368 Thornbird Dr
- 6230 Woodlark Dr
- 6180 Woodlark Dr
- 2 Mears Ave
- 1458 Mears Ave
- 6178 Woodlark Dr
Your Personal Tour Guide
Ask me questions while you tour the home.