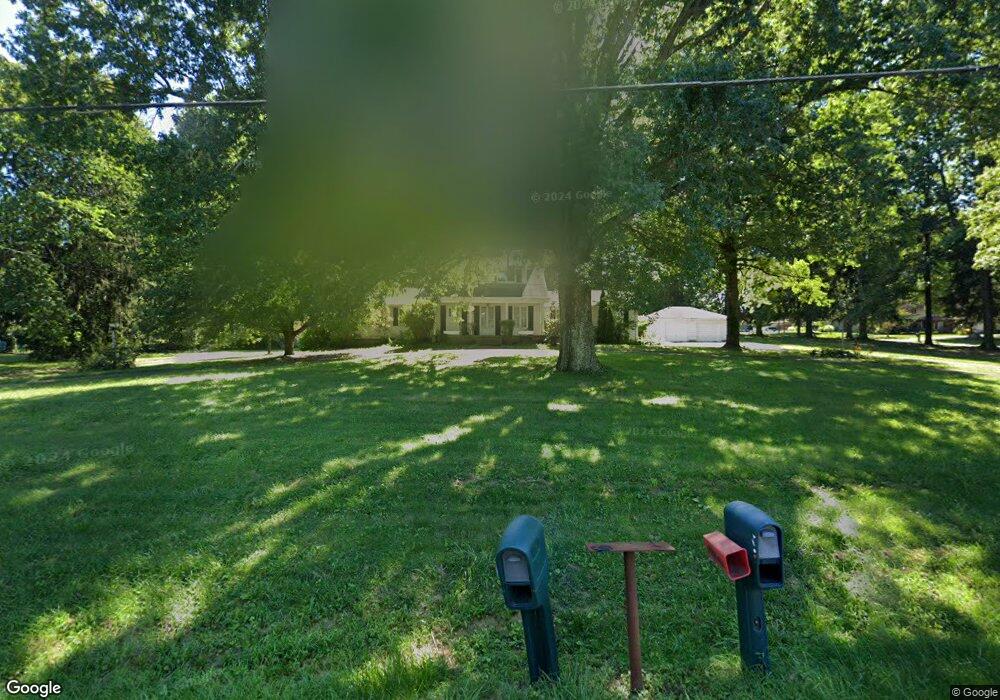
1384 Vanderhoof Rd Barberton, OH 44203
Estimated Value: $338,000 - $403,000
4
Beds
4
Baths
3,027
Sq Ft
$122/Sq Ft
Est. Value
About This Home
This home is located at 1384 Vanderhoof Rd, Barberton, OH 44203 and is currently estimated at $369,189, approximately $121 per square foot. 1384 Vanderhoof Rd is a home located in Summit County with nearby schools including Nolley Elementary School, Manchester High School, and St. Francis de Sales School.
Ownership History
Date
Name
Owned For
Owner Type
Purchase Details
Closed on
Aug 28, 2007
Sold by
Owens Pamela J and Prinz Jeffrey P
Bought by
Morris Deborah L
Current Estimated Value
Home Financials for this Owner
Home Financials are based on the most recent Mortgage that was taken out on this home.
Original Mortgage
$160,000
Outstanding Balance
$102,437
Interest Rate
6.79%
Mortgage Type
Purchase Money Mortgage
Estimated Equity
$266,752
Purchase Details
Closed on
Jun 18, 1997
Sold by
Zeigler Kevin K
Bought by
Prinz Pamela J and Prinz Jeffrey P
Home Financials for this Owner
Home Financials are based on the most recent Mortgage that was taken out on this home.
Original Mortgage
$150,000
Interest Rate
7.13%
Mortgage Type
New Conventional
Create a Home Valuation Report for This Property
The Home Valuation Report is an in-depth analysis detailing your home's value as well as a comparison with similar homes in the area
Home Values in the Area
Average Home Value in this Area
Purchase History
| Date | Buyer | Sale Price | Title Company |
|---|---|---|---|
| Morris Deborah L | $240,000 | Real Estate Title | |
| Prinz Pamela J | $151,000 | -- |
Source: Public Records
Mortgage History
| Date | Status | Borrower | Loan Amount |
|---|---|---|---|
| Open | Morris Deborah L | $160,000 | |
| Previous Owner | Prinz Pamela J | $150,000 |
Source: Public Records
Tax History Compared to Growth
Tax History
| Year | Tax Paid | Tax Assessment Tax Assessment Total Assessment is a certain percentage of the fair market value that is determined by local assessors to be the total taxable value of land and additions on the property. | Land | Improvement |
|---|---|---|---|---|
| 2025 | $4,188 | $93,090 | $15,726 | $77,364 |
| 2024 | $4,188 | $93,090 | $15,726 | $77,364 |
| 2023 | $4,188 | $93,090 | $15,726 | $77,364 |
| 2022 | $3,942 | $70,382 | $11,736 | $58,646 |
| 2021 | $3,956 | $70,382 | $11,736 | $58,646 |
| 2020 | $3,888 | $70,390 | $11,740 | $58,650 |
| 2019 | $3,798 | $62,710 | $8,950 | $53,760 |
| 2018 | $3,276 | $62,710 | $8,950 | $53,760 |
| 2017 | $2,931 | $62,710 | $8,950 | $53,760 |
| 2016 | $2,896 | $52,490 | $8,950 | $43,540 |
| 2015 | $2,931 | $52,490 | $8,950 | $43,540 |
| 2014 | $3,490 | $52,490 | $8,950 | $43,540 |
| 2013 | $3,845 | $58,290 | $8,950 | $49,340 |
Source: Public Records
Map
Nearby Homes
- 4851 Manchester Rd
- 4698 Manchester Rd
- 4567 Rex Lake Dr
- 715 Highland Park Dr
- 0 W Turkeyfoot Lake Rd Unit 5157637
- 4216 State Rd
- 6090 Manchester Rd Unit 6096
- 1850 Turkeyfoot Lake Rd
- 4135 State Park Dr
- S/L 14,15 Shakes Hotel Dr
- lot 8 Whyem Dr
- 4131 State Park Dr
- 855 Fowler Ave
- 3826 Powell Ave
- 3809 Powell Ave
- 7 Shrakes Hotel Dr
- 5 Shrakes Hotel Dr
- 6 Shrakes Hotel Dr
- 4 Shrakes Hotel Dr
- 3 Shrakes Hotel Dr
- 1384 Vanderhoof Rd
- 1397 Vanderhoof Rd
- 5152 Donner Dr
- 1370 Vanderhoof Rd
- 1417 Vanderhoof Rd
- 5175 Donner Dr
- 1407 Vanderhoof Rd
- 5166 Donner Dr
- 1430 Vanderhoof Rd
- 5187 Donner Dr
- 1355 Vanderhoof Rd
- 5178 Donner Dr
- 1387 Vanderhoof Rd
- 1442 Vanderhoof Rd
- 5188 Donner Dr
- 5199 Donner Dr
- 1342 Vanderhoof Rd
- 1443 Vanderhoof Rd
- 1325 Vanderhoof Rd
- 1454 Vanderhoof Rd