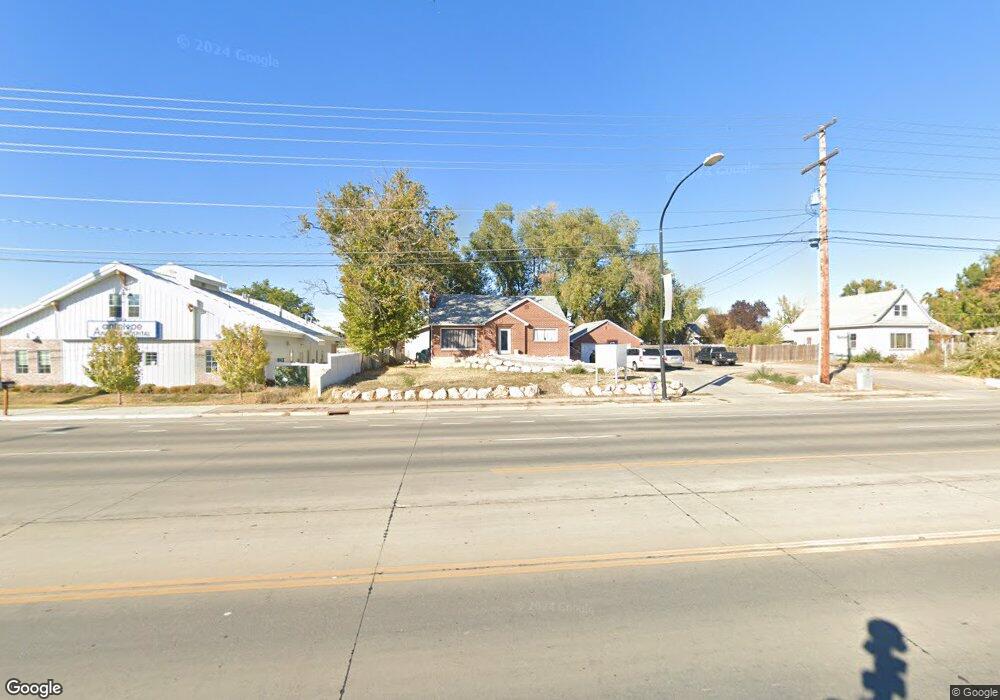
1384 W 1700 S Syracuse, UT 84075
Estimated Value: $415,489 - $586,000
5
Beds
1
Bath
2,458
Sq Ft
$188/Sq Ft
Est. Value
About This Home
This home is located at 1384 W 1700 S, Syracuse, UT 84075 and is currently estimated at $462,872, approximately $188 per square foot. 1384 W 1700 S is a home located in Davis County with nearby schools including Cook School, Syracuse Junior High School, and Syracuse High School.
Ownership History
Date
Name
Owned For
Owner Type
Purchase Details
Closed on
Mar 16, 2021
Sold by
Pietz Luz Derly
Bought by
Pietz Luz Derly and The Deny Pietz Trust
Current Estimated Value
Purchase Details
Closed on
Oct 1, 2018
Sold by
Leavitt Tyler Dean and Leavitt Leah Ann
Bought by
Pietz Luz Derly
Home Financials for this Owner
Home Financials are based on the most recent Mortgage that was taken out on this home.
Original Mortgage
$100,000
Interest Rate
4.5%
Mortgage Type
Purchase Money Mortgage
Purchase Details
Closed on
Oct 26, 2005
Sold by
Leavitt Mathew H and Leavitt Celinda O
Bought by
Leavitt Tyler Dean and Leavitt Leah Ann
Home Financials for this Owner
Home Financials are based on the most recent Mortgage that was taken out on this home.
Original Mortgage
$130,000
Interest Rate
5.68%
Mortgage Type
Seller Take Back
Create a Home Valuation Report for This Property
The Home Valuation Report is an in-depth analysis detailing your home's value as well as a comparison with similar homes in the area
Home Values in the Area
Average Home Value in this Area
Purchase History
| Date | Buyer | Sale Price | Title Company |
|---|---|---|---|
| Pietz Luz Derly | -- | None Available | |
| Pietz Luz Derly | -- | Backman Title Services | |
| Leavitt Tyler Dean | -- | -- | |
| Leavitt Mathew H | -- | -- |
Source: Public Records
Mortgage History
| Date | Status | Borrower | Loan Amount |
|---|---|---|---|
| Closed | Pietz Luz Derly | $100,000 | |
| Previous Owner | Leavitt Tyler Dean | $130,000 |
Source: Public Records
Tax History Compared to Growth
Tax History
| Year | Tax Paid | Tax Assessment Tax Assessment Total Assessment is a certain percentage of the fair market value that is determined by local assessors to be the total taxable value of land and additions on the property. | Land | Improvement |
|---|---|---|---|---|
| 2025 | $314 | $205,700 | $88,124 | $117,576 |
| 2024 | $300 | $195,799 | $105,007 | $90,792 |
| 2023 | $1,893 | $184,250 | $80,445 | $103,804 |
| 2022 | $2,041 | $360,000 | $152,861 | $207,139 |
| 2021 | $325 | $253,000 | $124,343 | $128,657 |
| 2020 | $1,513 | $220,000 | $107,871 | $112,129 |
| 2019 | $1,484 | $213,000 | $105,983 | $107,017 |
| 2018 | $1,340 | $191,000 | $102,064 | $88,936 |
| 2016 | $1,192 | $89,101 | $39,155 | $49,946 |
| 2015 | $1,192 | $84,865 | $39,026 | $45,839 |
| 2014 | $1,131 | $82,039 | $39,026 | $43,013 |
| 2013 | -- | $82,182 | $36,109 | $46,073 |
Source: Public Records
Map
Nearby Homes
- 1154 W 1700 S
- 1481 S Melanie Ln
- 1876 S 1230 W
- 1384 S Melanie Ln
- 1153 W 1875 S Unit 223
- 1622 S 1000 W
- 1466 Earl Cir
- 1385 S 1100 W
- 1142 W 2050 S
- 1148 W 2050 S
- 1327 S 1650 W
- 1121 W 1290 S
- 992 W 1910 S
- 1062 W 2050 S
- 1079 W 2050 S
- 1251 S 1650 W
- 1166 Dallas St
- 1027 W 2050 S
- 2000 S 1800 W
- 929 W 1920 S Unit A