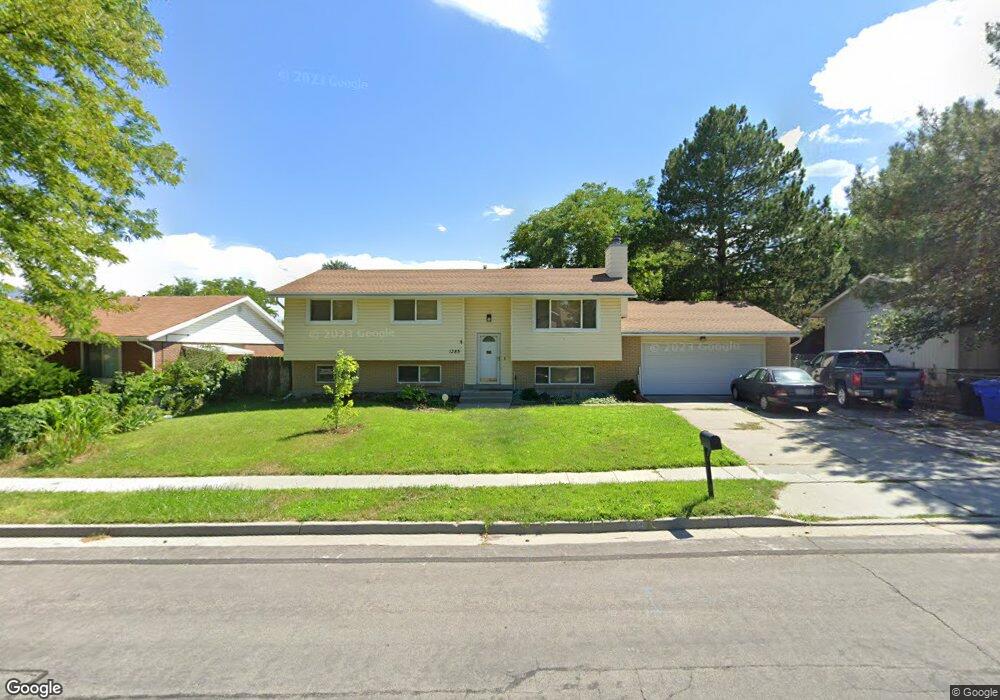
1385 Bluemont Dr Salt Lake City, UT 84123
Estimated Value: $498,000 - $622,000
4
Beds
2
Baths
2,308
Sq Ft
$233/Sq Ft
Est. Value
About This Home
This home is located at 1385 Bluemont Dr, Salt Lake City, UT 84123 and is currently estimated at $537,610, approximately $232 per square foot. 1385 Bluemont Dr is a home located in Salt Lake County with nearby schools including Calvin S Smith Elementary School, Bennion Junior High School, and Taylorsville High School.
Ownership History
Date
Name
Owned For
Owner Type
Purchase Details
Closed on
Sep 13, 2005
Sold by
Rulon J Rigby Inc
Bought by
Foran Pete Selden and Foran Anna Maria
Current Estimated Value
Home Financials for this Owner
Home Financials are based on the most recent Mortgage that was taken out on this home.
Original Mortgage
$40,000
Outstanding Balance
$21,279
Interest Rate
5.76%
Mortgage Type
Stand Alone Second
Estimated Equity
$516,331
Purchase Details
Closed on
Jul 19, 2005
Sold by
Kiesig Richard Carl and Kiesig Mary Z
Bought by
Rulon J Rigby Inc
Home Financials for this Owner
Home Financials are based on the most recent Mortgage that was taken out on this home.
Original Mortgage
$129,000
Outstanding Balance
$71,808
Interest Rate
6.5%
Mortgage Type
Purchase Money Mortgage
Estimated Equity
$465,802
Create a Home Valuation Report for This Property
The Home Valuation Report is an in-depth analysis detailing your home's value as well as a comparison with similar homes in the area
Home Values in the Area
Average Home Value in this Area
Purchase History
| Date | Buyer | Sale Price | Title Company |
|---|---|---|---|
| Foran Pete Selden | -- | First American Title | |
| Rulon J Rigby Inc | $146,200 | -- |
Source: Public Records
Mortgage History
| Date | Status | Borrower | Loan Amount |
|---|---|---|---|
| Open | Foran Pete Selden | $40,000 | |
| Open | Foran Pete Selden | $129,000 |
Source: Public Records
Tax History Compared to Growth
Tax History
| Year | Tax Paid | Tax Assessment Tax Assessment Total Assessment is a certain percentage of the fair market value that is determined by local assessors to be the total taxable value of land and additions on the property. | Land | Improvement |
|---|---|---|---|---|
| 2025 | $2,949 | $486,600 | $146,500 | $340,100 |
| 2024 | $2,949 | $473,300 | $141,900 | $331,400 |
| 2023 | $2,618 | $421,200 | $132,600 | $288,600 |
| 2022 | $2,727 | $433,500 | $130,000 | $303,500 |
| 2021 | $2,450 | $330,400 | $100,000 | $230,400 |
| 2020 | $2,203 | $294,600 | $92,000 | $202,600 |
| 2019 | $2,214 | $289,200 | $92,000 | $197,200 |
| 2018 | $2,123 | $267,300 | $89,000 | $178,300 |
| 2017 | $1,894 | $250,600 | $89,000 | $161,600 |
| 2016 | $1,775 | $234,700 | $89,000 | $145,700 |
| 2015 | $1,888 | $233,300 | $90,700 | $142,600 |
| 2014 | $1,814 | $220,200 | $86,500 | $133,700 |
Source: Public Records
Map
Nearby Homes
- 1481 W Bluemont Dr
- 1501 W Bluemont Dr
- 6660 S Ryker Vista Ln
- 1506 W 6235 S
- 6687 Bonham Ln
- 6738 Balfour Ln W
- 1471 W 6170 S
- 6773 S 1300 W
- 6189 S Elderberry Ln
- 1212 W Willow Run Dr
- 1297 Glencoe Dr
- 6891 S Columbia Dr
- 1193 W Dun Robin Ct
- 1179 W Dun Robin Ct
- 6683 Alice Susanna Ln
- 6494 S 1090 W Unit 152
- 6481 S 1090 W Unit 133
- 6987 Overview Way
- 6483 S 1040 W
- 7108 S 1205 W
- 1373 Bluemont Dr
- 1401 Bluemont Dr
- 1373 W Bluemont Dr
- 1392 Appomattox Way
- 1378 Appomattox Way
- 1402 Appomattox Way
- 1421 W Bluemont Dr
- 1421 Bluemont Dr
- 1361 Bluemont Dr
- 6451 S Coral Dr
- 6451 Coral Dr
- 1372 Bluemont Dr
- 1364 Appomattox Way
- 1364 W Appomattox Way
- 6498 Appomattox Way
- 6450 Coral Dr
- 6450 S Coral Dr
- 1360 Bluemont Dr
- 1431 Bluemont Dr
- 1349 Bluemont Dr