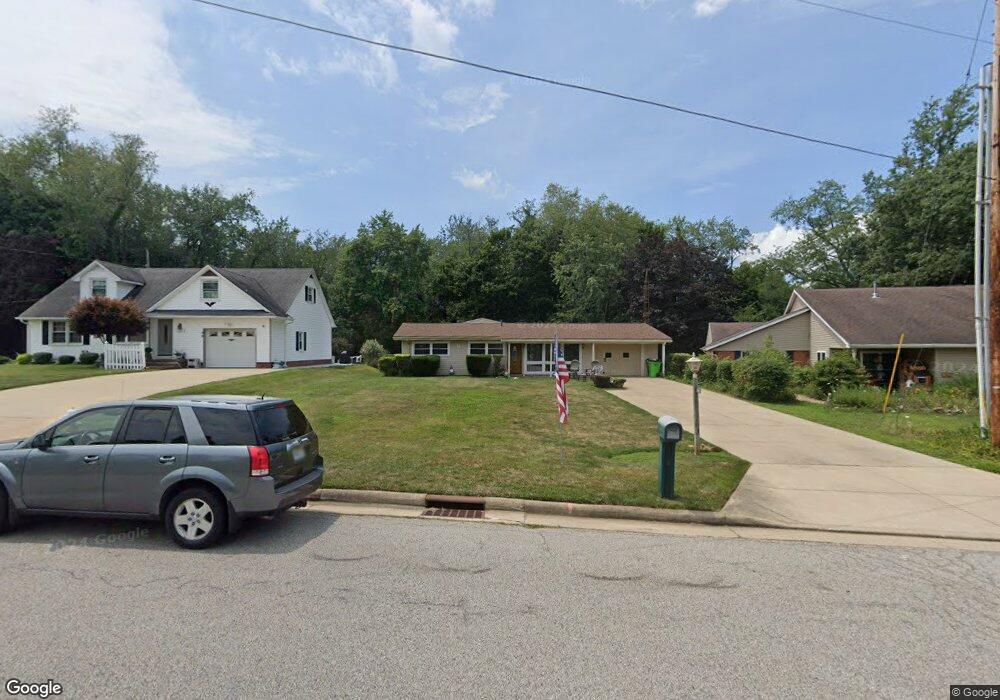
1385 Circle Hill Rd SE North Canton, OH 44720
Estimated Value: $242,990 - $305,000
4
Beds
2
Baths
2,016
Sq Ft
$138/Sq Ft
Est. Value
About This Home
This home is located at 1385 Circle Hill Rd SE, North Canton, OH 44720 and is currently estimated at $278,998, approximately $138 per square foot. 1385 Circle Hill Rd SE is a home located in Stark County with nearby schools including North Canton Middle School, Hoover High School, and St Paul School.
Ownership History
Date
Name
Owned For
Owner Type
Purchase Details
Closed on
Oct 2, 2002
Sold by
Glancy Dale R and Glancy Angela M
Bought by
Glancy Dale R and Glancy Angela M
Current Estimated Value
Home Financials for this Owner
Home Financials are based on the most recent Mortgage that was taken out on this home.
Original Mortgage
$115,800
Interest Rate
6.39%
Mortgage Type
Purchase Money Mortgage
Purchase Details
Closed on
Dec 8, 1999
Sold by
Glancy Kelley M
Bought by
Glancy Dale R
Purchase Details
Closed on
Apr 22, 1998
Sold by
Besse Todd M
Bought by
Glancy Dale R and Glancy Kelley M
Home Financials for this Owner
Home Financials are based on the most recent Mortgage that was taken out on this home.
Original Mortgage
$114,775
Interest Rate
7.26%
Mortgage Type
FHA
Purchase Details
Closed on
Aug 30, 1990
Create a Home Valuation Report for This Property
The Home Valuation Report is an in-depth analysis detailing your home's value as well as a comparison with similar homes in the area
Home Values in the Area
Average Home Value in this Area
Purchase History
| Date | Buyer | Sale Price | Title Company |
|---|---|---|---|
| Glancy Dale R | -- | -- | |
| Glancy Dale R | -- | -- | |
| Glancy Dale R | $115,500 | -- | |
| -- | $46,500 | -- |
Source: Public Records
Mortgage History
| Date | Status | Borrower | Loan Amount |
|---|---|---|---|
| Closed | Glancy Dale R | $115,800 | |
| Closed | Glancy Dale R | $114,775 |
Source: Public Records
Tax History Compared to Growth
Tax History
| Year | Tax Paid | Tax Assessment Tax Assessment Total Assessment is a certain percentage of the fair market value that is determined by local assessors to be the total taxable value of land and additions on the property. | Land | Improvement |
|---|---|---|---|---|
| 2025 | -- | $73,890 | $16,000 | $57,890 |
| 2024 | -- | $73,890 | $16,000 | $57,890 |
| 2023 | $2,554 | $47,750 | $11,870 | $35,880 |
| 2022 | $2,455 | $47,750 | $11,870 | $35,880 |
| 2021 | $2,455 | $47,750 | $11,870 | $35,880 |
| 2020 | $2,246 | $40,670 | $10,290 | $30,380 |
| 2019 | $2,097 | $40,670 | $10,290 | $30,380 |
| 2018 | $2,174 | $40,670 | $10,290 | $30,380 |
| 2017 | $2,031 | $39,910 | $9,210 | $30,700 |
| 2016 | $2,039 | $39,910 | $9,210 | $30,700 |
| 2015 | $2,047 | $39,910 | $9,210 | $30,700 |
| 2014 | $39 | $37,110 | $8,580 | $28,530 |
| 2013 | $1,023 | $37,110 | $8,580 | $28,530 |
Source: Public Records
Map
Nearby Homes
- 1381 Circle Hill Rd SE
- 139 Maplecrest St SW
- 1321 Clinton Ave SE
- 161 Hallum St SW
- 1603 S Main St Unit B
- 505 Rose Lane St SE
- 218 Bonnett St SW
- 1126 Overridge Ave SE
- 1118 Overridge Ave SE
- 322 Schneider St SE
- 1690 Carlton Ave SE
- 714 Pershing Ave SE
- 500 Heatherwood St SW
- 634 Edgewood St SE
- 1801 49th St NW
- 253 Glenwood St SW
- 1224 Grassmere St SE
- 701 Edgewood St SE
- 404 Cordelia St SW
- 1338 Shiloh Run SE
- 1387 Circle Hill Rd SE
- 1383 Circle Hill Rd SE
- 1389 Circle Hill Rd SE
- 1379 Circle Hill Rd SE
- 608 Penny St SE
- 1391 Circle Hill Rd SE
- 1380 Circle Hill Rd SE
- 1388 Circle Hill Rd SE
- 1377 Circle Hill Rd SE
- 1378 Circle Hill Rd SE
- 1393 Circle Hill Rd SE
- 501 Easthill St SE
- 501 Easthill St SE Unit UP
- 622 Penny St SE
- 1392 Circle Hill Rd SE
- 511 Easthill St SE
- 1390 Circle Hill Rd SE
- 1374 Circle Hill Rd SE
- 621 Penny St SE
- 1375 Circle Hill Rd SE