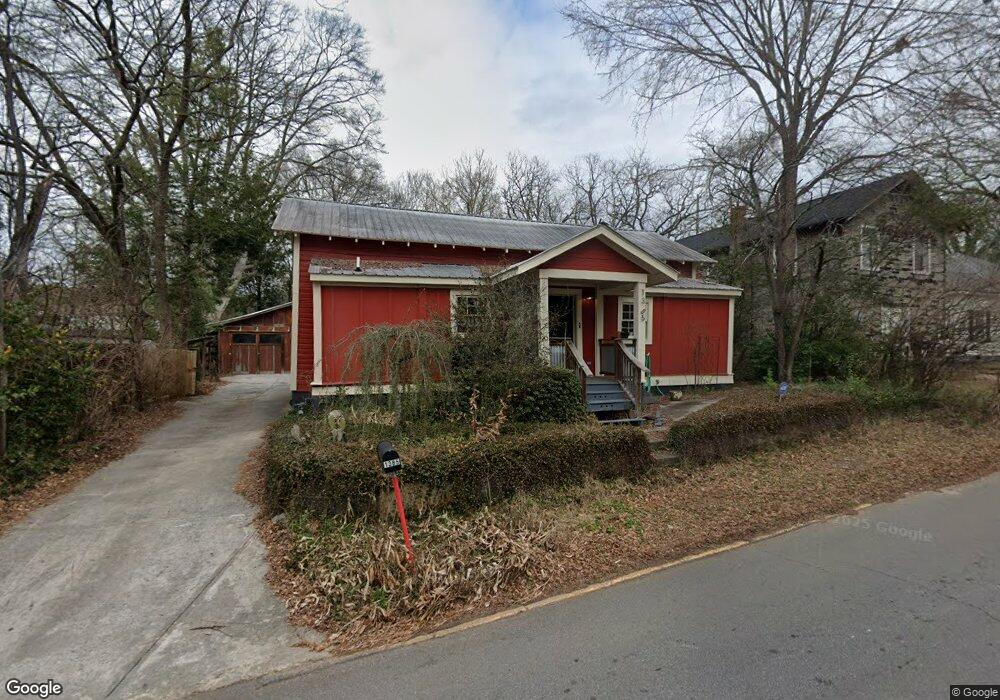
1385 E Broad St Athens, GA 30601
Chicopee-Dudley NeighborhoodEstimated Value: $389,000 - $429,000
2
Beds
2
Baths
1,276
Sq Ft
$316/Sq Ft
Est. Value
About This Home
This home is located at 1385 E Broad St, Athens, GA 30601 and is currently estimated at $403,322, approximately $316 per square foot. 1385 E Broad St is a home located in Clarke County with nearby schools including Gaines Elementary School, Hilsman Middle School, and Cedar Shoals High School.
Ownership History
Date
Name
Owned For
Owner Type
Purchase Details
Closed on
Dec 28, 2020
Sold by
Hulse Melissa C
Bought by
Dingus Emily C and Dingus Thomas Alan
Current Estimated Value
Purchase Details
Closed on
Mar 10, 2017
Sold by
Seabolt Lane
Bought by
Dingus Emily C
Home Financials for this Owner
Home Financials are based on the most recent Mortgage that was taken out on this home.
Original Mortgage
$166,400
Interest Rate
4.17%
Mortgage Type
New Conventional
Purchase Details
Closed on
Jun 2, 2009
Sold by
Bryan David A
Bought by
Seabolt Lane
Home Financials for this Owner
Home Financials are based on the most recent Mortgage that was taken out on this home.
Original Mortgage
$116,000
Interest Rate
4.77%
Mortgage Type
New Conventional
Purchase Details
Closed on
Sep 5, 2008
Sold by
Evans Sylvia W
Bought by
Bryan David A
Purchase Details
Closed on
Nov 20, 1996
Sold by
Barnett Leo
Bought by
Evans Sylvia W
Create a Home Valuation Report for This Property
The Home Valuation Report is an in-depth analysis detailing your home's value as well as a comparison with similar homes in the area
Home Values in the Area
Average Home Value in this Area
Purchase History
| Date | Buyer | Sale Price | Title Company |
|---|---|---|---|
| Dingus Emily C | -- | -- | |
| Dingus Emily C | $208,000 | -- | |
| Seabolt Lane | $145,000 | -- | |
| Seabolt Lane | $145,000 | -- | |
| Bryan David A | $75,000 | -- | |
| Evans Sylvia W | $35,000 | -- |
Source: Public Records
Mortgage History
| Date | Status | Borrower | Loan Amount |
|---|---|---|---|
| Previous Owner | Dingus Emily C | $166,400 | |
| Previous Owner | Seabolt Lane | $116,000 | |
| Closed | Bryan David A | $0 |
Source: Public Records
Tax History
| Year | Tax Paid | Tax Assessment Tax Assessment Total Assessment is a certain percentage of the fair market value that is determined by local assessors to be the total taxable value of land and additions on the property. | Land | Improvement |
|---|---|---|---|---|
| 2025 | $4,826 | $155,427 | $24,000 | $131,427 |
| 2024 | $4,826 | $154,481 | $24,000 | $130,481 |
| 2023 | $4,828 | $142,374 | $24,000 | $118,374 |
| 2022 | $3,873 | $121,402 | $18,000 | $103,402 |
| 2021 | $3,811 | $113,098 | $18,000 | $95,098 |
| 2020 | $3,490 | $103,564 | $18,000 | $85,564 |
| 2019 | $3,132 | $92,254 | $18,000 | $74,254 |
| 2018 | $2,810 | $82,771 | $17,000 | $65,771 |
| 2017 | $1,559 | $55,929 | $17,000 | $38,929 |
| 2016 | $1,500 | $54,187 | $17,000 | $37,187 |
| 2015 | $1,518 | $54,647 | $17,000 | $37,647 |
| 2014 | $1,537 | $55,107 | $17,000 | $38,107 |
Source: Public Records
Map
Nearby Homes
- 132 N Poplar St
- 126 S Poplar St
- 1295 E Broad St Unit C5
- 1295 E Broad St
- 1435 E Broad St
- 147 S Poplar St
- 1437 E Broad St
- 248 Rear Arch St
- 125 Harper St
- 235 Arch St
- 257 Arch St
- 263 Arch St
- 261 Arch St
- 169 Vine St
- 357 S Peter St
- 225 Oak St Unit 104
- 225 Oak St
- 225 Oak St Unit 108
- 225 Oak St Unit LOT 103
- 225 Oak St Unit 7
- 1385 1385 East Broad St
- 1365 E Broad St
- 1395 E Broad St
- 129 N Peter St
- 125 N Peter St Unit A
- 125 N Peter St
- 125 N Peter St Unit B
- 122 N Poplar St
- 135 N Peter St
- 120 N Poplar St
- 124 N Poplar St
- 1326 E Broad St
- 1392 E Broad St
- 137 N Peter St
- 1324 E Broad St
- 1398 E Broad St
- 126 N Poplar St
- 1423 E Broad St
- 0 E Broad St Unit CM937701
- 0 E Broad St Unit CM937704
Your Personal Tour Guide
Ask me questions while you tour the home.