Estimated Value: $718,000 - $785,000
5
Beds
4
Baths
3,415
Sq Ft
$219/Sq Ft
Est. Value
About This Home
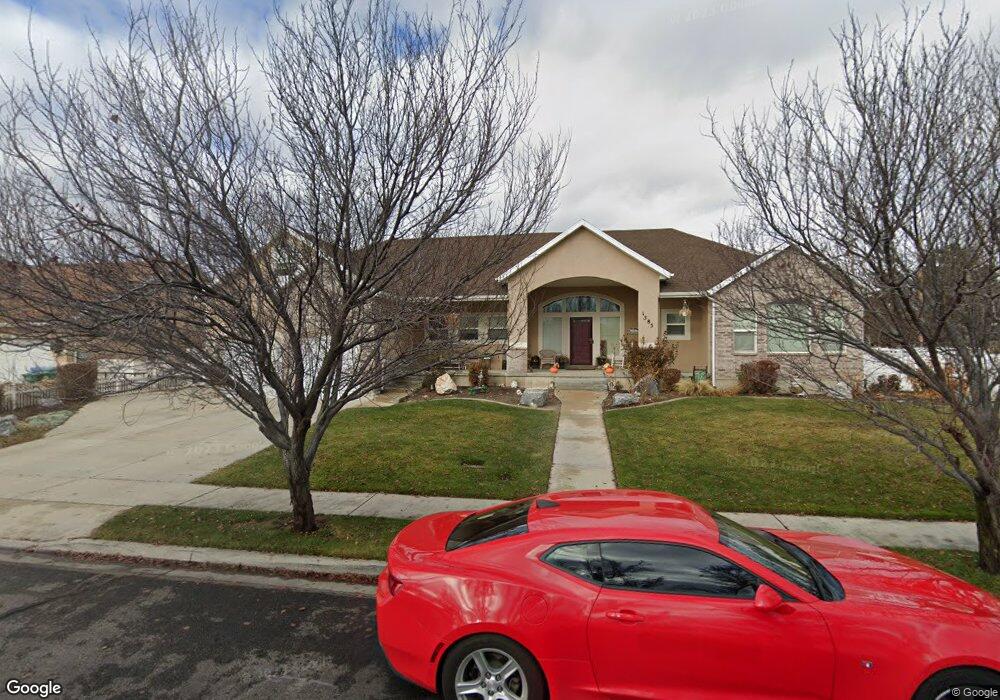
This home is located at 1385 E Damie Ln, Lehi, UT 84043 and is currently estimated at $749,258, approximately $219 per square foot. 1385 E Damie Ln is a home located in Utah County with nearby schools including Freedom Elementary School, Lehi Junior High School, and Skyridge High School.
Ownership History
Date
Name
Owned For
Owner Type
Purchase Details
Closed on
Sep 19, 2024
Sold by
Arroyo Jose A Leon and Leon Heather L
Bought by
Arroyo Jose A Leon and Leon Heather L
Current Estimated Value
Home Financials for this Owner
Home Financials are based on the most recent Mortgage that was taken out on this home.
Original Mortgage
$560,642
Outstanding Balance
$554,195
Interest Rate
6.35%
Mortgage Type
FHA
Estimated Equity
$195,063
Purchase Details
Closed on
Jan 20, 2014
Sold by
Bishop Polly J and The Dennis & Polly Bishop Fami
Bought by
Leon Jose A and Leon Heather
Home Financials for this Owner
Home Financials are based on the most recent Mortgage that was taken out on this home.
Original Mortgage
$349,600
Interest Rate
4.4%
Mortgage Type
New Conventional
Purchase Details
Closed on
Feb 28, 2006
Sold by
Bishop Dennis L and Bishop Polly
Bought by
Bishop Dennis L and Bishop Polly J
Purchase Details
Closed on
Aug 18, 2003
Sold by
Patterson Homes Inc
Bought by
Bishop Dennis L and Bishop Polly
Create a Home Valuation Report for This Property
The Home Valuation Report is an in-depth analysis detailing your home's value as well as a comparison with similar homes in the area
Home Values in the Area
Average Home Value in this Area
Purchase History
| Date | Buyer | Sale Price | Title Company |
|---|---|---|---|
| Arroyo Jose A Leon | -- | None Listed On Document | |
| Leon Jose A | -- | Backman Title Services Ltd | |
| Bishop Dennis L | -- | None Available | |
| Bishop Dennis L | -- | Signature Title | |
| Patterson Homes Inc | -- | Signature Title |
Source: Public Records
Mortgage History
| Date | Status | Borrower | Loan Amount |
|---|---|---|---|
| Open | Arroyo Jose A Leon | $560,642 | |
| Previous Owner | Leon Jose A | $349,600 |
Source: Public Records
Tax History
| Year | Tax Paid | Tax Assessment Tax Assessment Total Assessment is a certain percentage of the fair market value that is determined by local assessors to be the total taxable value of land and additions on the property. | Land | Improvement |
|---|---|---|---|---|
| 2025 | $2,750 | $368,005 | -- | -- |
| 2024 | $2,750 | $321,860 | $0 | $0 |
| 2023 | $2,581 | $327,965 | $0 | $0 |
| 2022 | $2,639 | $325,105 | $0 | $0 |
| 2021 | $2,368 | $441,000 | $134,200 | $306,800 |
| 2020 | $2,233 | $411,000 | $124,300 | $286,700 |
| 2019 | $2,128 | $407,300 | $124,300 | $283,000 |
| 2018 | $2,089 | $377,900 | $118,900 | $259,000 |
| 2017 | $2,044 | $196,570 | $0 | $0 |
| 2016 | $2,081 | $185,735 | $0 | $0 |
| 2015 | $2,163 | $183,260 | $0 | $0 |
| 2014 | $2,008 | $169,070 | $0 | $0 |
Source: Public Records
Map
Nearby Homes
- 10365 N 6960 W
- 975 E 2850 N
- 878 E 3050 N
- 6756 W 10050 N
- 1602 E Center Pointe Dr
- 1610 E Center Pointe Dr
- 1618 E Center Pointe Dr
- 9967 N 6670 W
- 3368 N 700 E
- 3239 N 620 E
- 9932 N 6520 W Unit 40
- 4233 N 325 E Unit 1415
- 6576 W 9810 N
- 532 E 3270 N
- 2539 N 300 E
- 565 E 3375 N
- 1370 N Cedar Hollow Blvd
- 1272 N Cedar Hollow Blvd
- 173 E Forehand Ln
- 9435 N Aspen Hollow Cir
- 1385 Damie Ln
- 1409 E Damie Ln
- 1409 Damie Ln
- 1363 Damie Ln
- 1363 E Damie Ln
- 1390 E Damie Ln
- 1390 Damie Ln
- 1366 Damie Ln
- 10418 N Iverson Ln Unit 101
- 1412 Damie Ln
- 1341 Damie Ln
- 2587 N 1450 E
- 1341 E Damie Ln
- 7033 W Iverson Cir
- 10417 N Iverson Ln
- 1335 E 2500 N
- 1387 E 2500 N
- 1365 E 2500 N
- 10438 Iverson Ln
- 10438 N Iverson Ln
Your Personal Tour Guide
Ask me questions while you tour the home.