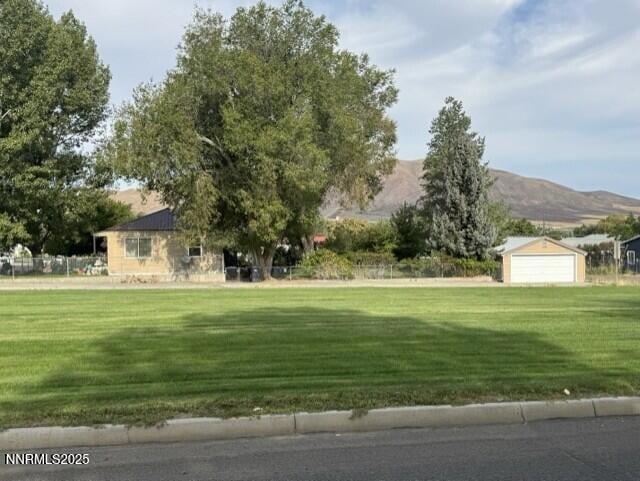
1385 S Bridge St Winnemucca, NV 89445
Estimated payment $1,712/month
Highlights
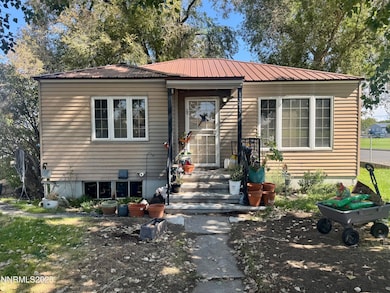
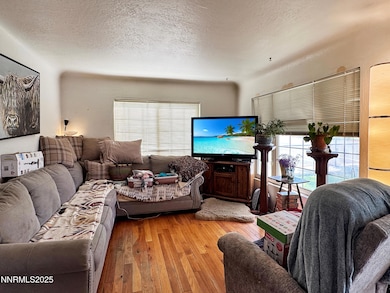
- Separate Formal Living Room
- No HOA
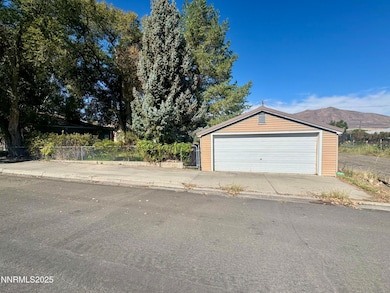
- 2 Car Detached Garage
- Corner Lot
- Covered Patio or Porch
- Double Pane Windows
About This Home
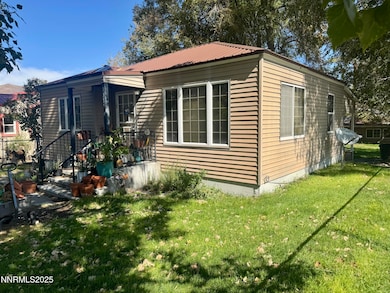
This cozy home is situated in the heart of town on a corner lot. The main level has 2 bedrooms, one bath and one room being used as work room and the other as a bedroom. Mature landscaping surrounds the home. Located behind the home is a 2 car garage with a workshop room.
Home Details
Home Type
- Single Family
Est. Annual Taxes
- $1,013
Year Built
- Built in 1948
Lot Details
- 6,534 Sq Ft Lot
- Property is Fully Fenced
- Landscaped
- Corner Lot
- Sprinklers on Timer
- Property is zoned R-1-6
Parking
- 2 Car Detached Garage
- Garage Door Opener
Home Design
- Slab Foundation
- Pitched Roof
- Metal Siding
- Stick Built Home
Interior Spaces
- 1,444 Sq Ft Home
- 1-Story Property
- Double Pane Windows
- Vinyl Clad Windows
- Blinds
- Separate Formal Living Room
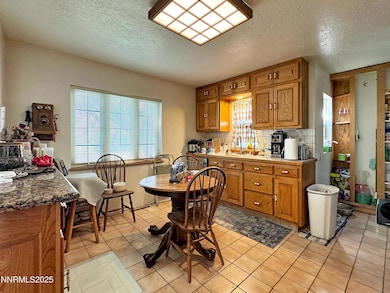
- Combination Kitchen and Dining Room
- Fire and Smoke Detector
- Finished Basement
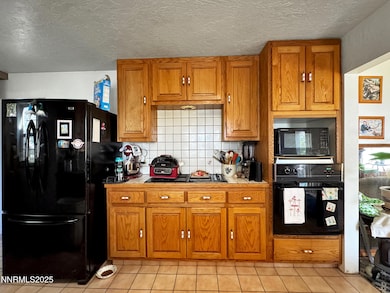
Kitchen
- Built-In Oven
- Gas Cooktop
- Dishwasher
- Disposal
Flooring
- Carpet
- Ceramic Tile
Bedrooms and Bathrooms
- 3 Bedrooms
- 1 Full Bathroom
Laundry
- Laundry Room
- Dryer
- Washer
Outdoor Features
- Covered Patio or Porch
Schools
- Sonoma Heights Elementary School
- French Ford Middle School
- Albert Lowry High School
Utilities
- Refrigerated Cooling System
- Forced Air Heating and Cooling System
- Heating System Uses Natural Gas
- Natural Gas Connected
- Electric Water Heater
Community Details
- No Home Owners Association
- Winnemucca Community
- Harmony Sub Subdivision
- The community has rules related to covenants, conditions, and restrictions
Listing and Financial Details
- Assessor Parcel Number 16-0026-04
Map
Home Values in the Area
Average Home Value in this Area
Tax History
| Year | Tax Paid | Tax Assessment Tax Assessment Total Assessment is a certain percentage of the fair market value that is determined by local assessors to be the total taxable value of land and additions on the property. | Land | Improvement |
|---|---|---|---|---|
| 2025 | $2,113 | $29,595 | $10,675 | $18,920 |
| 2024 | $955 | $28,968 | $10,675 | $18,293 |
| 2023 | $955 | $25,732 | $8,925 | $16,807 |
| 2022 | $834 | $22,904 | $8,925 | $13,979 |
| 2021 | $823 | $22,530 | $8,925 | $13,605 |
| 2020 | $823 | $22,532 | $8,925 | $13,607 |
| 2019 | $800 | $21,816 | $8,925 | $12,891 |
| 2018 | $784 | $21,313 | $8,925 | $12,388 |
| 2017 | $776 | $21,075 | $8,925 | $12,150 |
| 2016 | $778 | $20,998 | $8,925 | $12,073 |
| 2015 | $712 | $20,672 | $8,925 | $11,747 |
| 2014 | $712 | $20,225 | $8,925 | $11,300 |
Property History
| Date | Event | Price | List to Sale | Price per Sq Ft |
|---|---|---|---|---|
| 09/11/2025 09/11/25 | For Sale | $309,000 | -- | $214 / Sq Ft |
Purchase History
| Date | Type | Sale Price | Title Company |
|---|---|---|---|
| Interfamily Deed Transfer | -- | None Available |
Source: Northern Nevada Regional MLS
MLS Number: 250055763
APN: 16-0026-04
Disclaimer: Certain information contained herein is derived from information provided by parties other than Homes.com. All information provided is deemed reliable, but is not guaranteed to be accurate and should be independently verified.
![]() IDX information is provided exclusively for personal, non-commercial use, and may not be used for any purpose other than to identify prospective properties consumers may be interested in purchasing. Information is deemed reliable but not guaranteed. The content relating to real estate for sale on this web site comes in part from the Broker Reciprocity/ IDX program of the Northern Nevada Regional Multiple Listing Service°. Real estate listings held by brokerage firms other than Ten-X are marked with the Broker Reciprocity logo and detailed information about those listings includes the name of the listing brokerage. Any use of the content other than by a search performed by a consumer looking to purchase or rent real estate is prohibited. © 2025 Northern Nevada Regional Multiple Listing Service® MLS. All rights reserved.
IDX information is provided exclusively for personal, non-commercial use, and may not be used for any purpose other than to identify prospective properties consumers may be interested in purchasing. Information is deemed reliable but not guaranteed. The content relating to real estate for sale on this web site comes in part from the Broker Reciprocity/ IDX program of the Northern Nevada Regional Multiple Listing Service°. Real estate listings held by brokerage firms other than Ten-X are marked with the Broker Reciprocity logo and detailed information about those listings includes the name of the listing brokerage. Any use of the content other than by a search performed by a consumer looking to purchase or rent real estate is prohibited. © 2025 Northern Nevada Regional Multiple Listing Service® MLS. All rights reserved.
- 0 Julie Ct
- 20 Julie Ct
- 45 Julie Ct
- 1399 Ocala St
- 253 N Highland Dr
- 121 W Shepard St
- 1698 Ballard Ln
- 240 Circle Dr
- 134 W Shepard St
- 103 W Haskell St
- 1673 Midas Dr
- TBD E Haskell St
- 502 Prebble St
- 702 W Mcarthur Ave Unit 56
- 702 W Mcarthur Ave Unit 82
- 3200 Kensington Dr
- 3 Colado Ct
- 273 Mccoy St
- 5270 Marla Dr Unit 14
- 539 S Bridge St
