1385 Standpipe Rd Jackson, OH 45640
Estimated Value: $131,146 - $350,000
2
Beds
1
Bath
1,986
Sq Ft
$120/Sq Ft
Est. Value
About This Home
This home is located at 1385 Standpipe Rd, Jackson, OH 45640 and is currently estimated at $239,287, approximately $120 per square foot. 1385 Standpipe Rd is a home located in Jackson County with nearby schools including Jackson High School.
Ownership History
Date
Name
Owned For
Owner Type
Purchase Details
Closed on
Oct 23, 2020
Sold by
Mccarty James R and Mccarty Bethany
Bought by
Farley Andrew A
Current Estimated Value
Home Financials for this Owner
Home Financials are based on the most recent Mortgage that was taken out on this home.
Original Mortgage
$88,000
Outstanding Balance
$78,252
Interest Rate
3.37%
Mortgage Type
New Conventional
Estimated Equity
$161,035
Purchase Details
Closed on
Dec 5, 2005
Sold by
Deutsche Bank Trust Co
Bought by
Mccarty James R
Home Financials for this Owner
Home Financials are based on the most recent Mortgage that was taken out on this home.
Original Mortgage
$55,000
Interest Rate
6.34%
Mortgage Type
New Conventional
Purchase Details
Closed on
Jul 24, 2002
Sold by
Koons Fred K
Bought by
Maynard Dennis E
Purchase Details
Closed on
Sep 30, 2000
Sold by
Koons Fred K and Koons Jill A
Bought by
Koons Fred K
Purchase Details
Closed on
Dec 12, 1996
Sold by
Rupert John P
Bought by
Koons Fred K and Koons Jill A
Create a Home Valuation Report for This Property
The Home Valuation Report is an in-depth analysis detailing your home's value as well as a comparison with similar homes in the area
Purchase History
| Date | Buyer | Sale Price | Title Company |
|---|---|---|---|
| Farley Andrew A | $110,000 | Bestitle Agency | |
| Mccarty James R | $65,000 | Accutitle Agency Inc | |
| Maynard Dennis E | $100,000 | -- | |
| Koons Fred K | -- | -- | |
| Koons Fred K | $94,000 | -- |
Source: Public Records
Mortgage History
| Date | Status | Borrower | Loan Amount |
|---|---|---|---|
| Open | Farley Andrew A | $88,000 | |
| Previous Owner | Mccarty James R | $55,000 |
Source: Public Records
Tax History
| Year | Tax Paid | Tax Assessment Tax Assessment Total Assessment is a certain percentage of the fair market value that is determined by local assessors to be the total taxable value of land and additions on the property. | Land | Improvement |
|---|---|---|---|---|
| 2024 | $95 | $2,690 | $2,020 | $670 |
| 2023 | $96 | $2,690 | $2,020 | $670 |
| 2022 | $128 | $2,680 | $1,710 | $970 |
| 2021 | $103 | $2,680 | $1,710 | $970 |
| 2020 | $104 | $2,680 | $1,710 | $970 |
| 2019 | $96 | $2,430 | $1,550 | $880 |
| 2018 | $92 | $2,430 | $1,550 | $880 |
| 2017 | $88 | $2,430 | $1,550 | $880 |
| 2016 | $1,647 | $44,890 | $2,920 | $41,970 |
| 2015 | $1,657 | $44,890 | $2,920 | $41,970 |
| 2013 | $1,580 | $43,120 | $2,920 | $40,200 |
| 2012 | $1,604 | $43,120 | $2,920 | $40,200 |
Source: Public Records
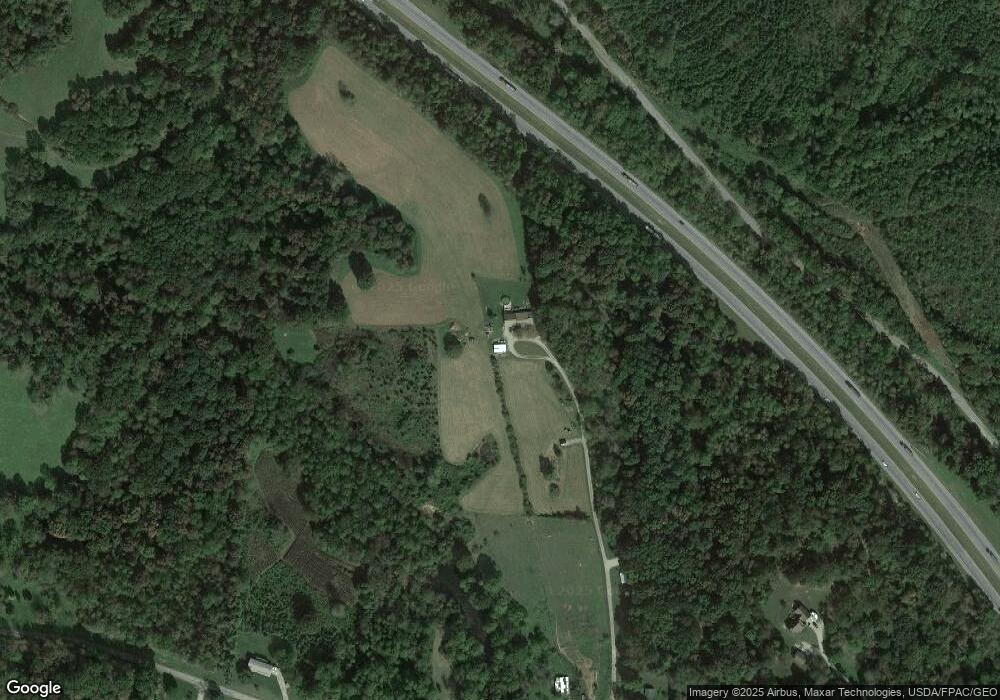
Map
Nearby Homes
- 385 Gleandonshire Ln
- 0 Keystone Furnace Rd Unit 11604343
- 366 Lewis Rd
- 563 Lewis Rd
- 2246 Cutlip Rd
- 0 Acy Ave
- 600 Acy Ave
- 0 Industry Dr
- 129 Florence Ave
- 1951 Mayhew Rd
- 0 Main and Ballard St
- 281 Pattonsville Rd
- 1610 Erwin Rd
- 41 Gay St
- 0 Four Mile Rd Unit 226002566
- 0 Four Mile Rd Unit 2434442
- 387 E Broadway St
- 273 Harding Ave
- 8954 Ch&d Rd
- 603 Fairgreens Rd
- 1381 Standpipe Rd
- 1411 Standpipe Rd
- 1187 Standpipe Rd
- 1316 Standpipe Rd
- 1242 Standpipe Rd
- 1459 Standpipe Rd
- 1210 Standpipe Rd
- 1150 Standpipe Rd
- 1519 Standpipe Rd
- 1420 Standpipe Rd
- 1567 Standpipe Rd
- 1456 Standpipe Rd
- 1535 Standpipe Rd
- 924 Clary Rd
- 1541 Standpipe Rd
- 1542 Standpipe Rd
- 1482 Standpipe Rd
- 974 Standpipe Rd
- 1581 Standpipe Rd
- 1620 Standpipe Rd