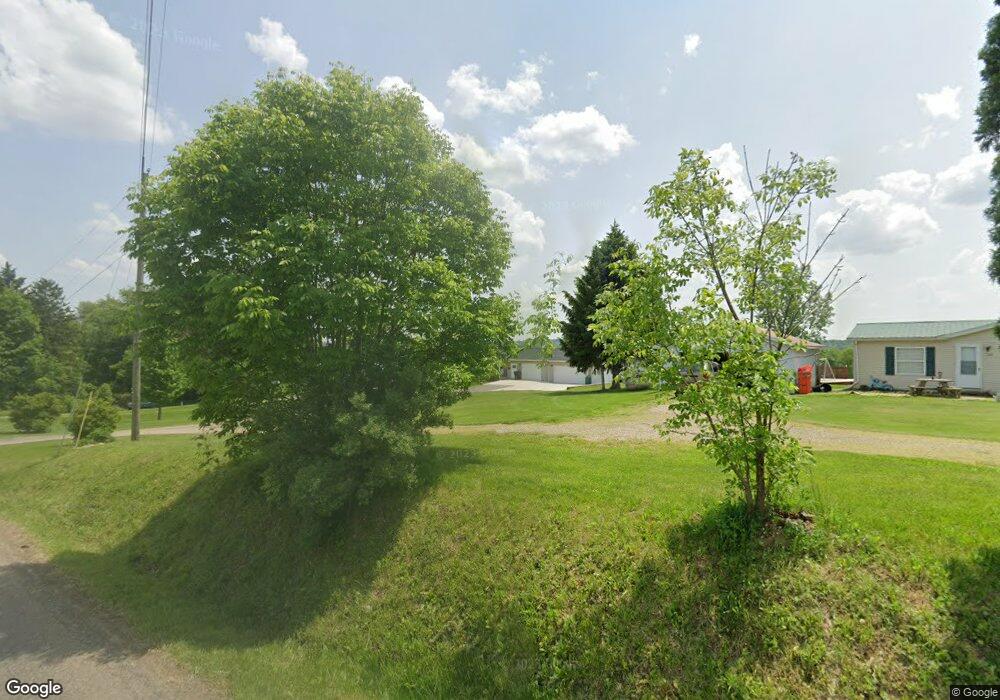
13856 Mishey Rd Fredericktown, OH 43019
Estimated Value: $301,996 - $333,000
2
Beds
2
Baths
1,144
Sq Ft
$280/Sq Ft
Est. Value
About This Home
This home is located at 13856 Mishey Rd, Fredericktown, OH 43019 and is currently estimated at $320,249, approximately $279 per square foot. 13856 Mishey Rd is a home located in Knox County with nearby schools including Fredericktown Elementary School, Fredericktown Middle School, and Fredericktown High School.
Ownership History
Date
Name
Owned For
Owner Type
Purchase Details
Closed on
Feb 26, 2013
Sold by
Hines Robert W and Hines Marjorie J
Bought by
Thorne James R and Thorne Jamie M
Current Estimated Value
Home Financials for this Owner
Home Financials are based on the most recent Mortgage that was taken out on this home.
Original Mortgage
$96,300
Outstanding Balance
$67,337
Interest Rate
3.34%
Mortgage Type
New Conventional
Estimated Equity
$252,912
Purchase Details
Closed on
Nov 19, 2001
Sold by
Hines Robert W and Hines Marjorie
Bought by
Hines Robert W and Hines Marjorie
Purchase Details
Closed on
Mar 21, 1996
Sold by
Hines Robert K and Hines Marjorie
Bought by
Hines Robert W and Hines Marjorie
Purchase Details
Closed on
Nov 19, 1993
Sold by
Barton Robert C and Barton Frances
Bought by
Hines Robert K and Hines Marjorie
Purchase Details
Closed on
Mar 26, 1992
Sold by
Rust Pauline Marie
Bought by
Barton Robert C and Barton Frances
Purchase Details
Closed on
Mar 22, 1991
Sold by
Barton Mae E
Bought by
Rust Pauline Marie
Create a Home Valuation Report for This Property
The Home Valuation Report is an in-depth analysis detailing your home's value as well as a comparison with similar homes in the area
Purchase History
| Date | Buyer | Sale Price | Title Company |
|---|---|---|---|
| Thorne James R | $80,250 | None Available | |
| Hines Robert W | -- | -- | |
| Hines Robert W | -- | -- | |
| Hines Robert K | $6,000 | -- | |
| Barton Robert C | $500 | -- | |
| Rust Pauline Marie | -- | -- |
Source: Public Records
Mortgage History
| Date | Status | Borrower | Loan Amount |
|---|---|---|---|
| Open | Thorne James R | $96,300 |
Source: Public Records
Tax History Compared to Growth
Tax History
| Year | Tax Paid | Tax Assessment Tax Assessment Total Assessment is a certain percentage of the fair market value that is determined by local assessors to be the total taxable value of land and additions on the property. | Land | Improvement |
|---|---|---|---|---|
| 2024 | $3,243 | $83,450 | $13,200 | $70,250 |
| 2023 | $3,243 | $83,450 | $13,200 | $70,250 |
| 2022 | $2,534 | $57,550 | $9,100 | $48,450 |
| 2021 | $2,534 | $57,550 | $9,100 | $48,450 |
| 2020 | $2,106 | $48,560 | $9,100 | $39,460 |
| 2019 | $2,009 | $44,260 | $9,080 | $35,180 |
| 2018 | $2,008 | $44,260 | $9,080 | $35,180 |
| 2017 | $1,977 | $44,260 | $9,080 | $35,180 |
| 2016 | $1,829 | $40,970 | $8,400 | $32,570 |
| 2015 | $1,830 | $40,970 | $8,400 | $32,570 |
| 2014 | $1,752 | $40,970 | $8,400 | $32,570 |
| 2013 | $1,410 | $39,770 | $7,900 | $31,870 |
Source: Public Records
Map
Nearby Homes
- 12760 Hilltop Dr
- 11810 Woodview Ln
- 0 Divelbiss Rd
- 17597 Spillway Rd
- 17597 Spillway Dr
- 0 Mishey Rd
- 76 Smith Rd
- 203 Taylor St
- 53 Zent Ave
- 65 W College St
- 0 Upper Fredericktown Rd
- 55 Colony Dr
- 6 Adena Ct
- 14 Summit Dr
- 6533 Durbin Rd
- 479 Ross Rd
- 25 Crestview Dr
- 7086 State Route 546
- 0 Crooked St
- 0 Crooked Street Land Split 2
- 13870 Mishey Rd
- 13830 Mishey Rd
- 14000 Mishey Rd
- 14005 Mishey Rd
- 13662 Mishey Rd
- 13636 Mishey Rd
- 19979 Knox Lake Rd
- 13518 Mishey Rd
- 20021 Knox Lake Rd
- 13498 Mishey Rd
- 19831 Knox Lake Rd
- 13468 Mishey Rd
- 19771 Knox Lake Rd
- 13531 Beaver Dr
- 14261 Spohn Rd
- 13495 Beaver Dr
- 14302 Spohn Rd
- 19697 Knox Lake Rd
- 19880 Knox Lake Rd
- 13485 Beaver Dr