1386 Minor Ridge Ct Charlottesville, VA 22901
29 North NeighborhoodEstimated Value: $287,000 - $344,000
3
Beds
3
Baths
1,419
Sq Ft
$227/Sq Ft
Est. Value
About This Home
This home is located at 1386 Minor Ridge Ct, Charlottesville, VA 22901 and is currently estimated at $322,368, approximately $227 per square foot. 1386 Minor Ridge Ct is a home located in Albemarle County with nearby schools including Agnor Elementary School, Jackson P. Burley Middle School, and Albemarle High School.
Ownership History
Date
Name
Owned For
Owner Type
Purchase Details
Closed on
Mar 8, 2016
Sold by
Brown Taylor B and Brown Anne M
Bought by
Eubanks Nikki
Current Estimated Value
Home Financials for this Owner
Home Financials are based on the most recent Mortgage that was taken out on this home.
Original Mortgage
$183,000
Outstanding Balance
$145,514
Interest Rate
3.79%
Mortgage Type
VA
Estimated Equity
$176,854
Purchase Details
Closed on
Jul 31, 2012
Sold by
Geer Phoebe T
Bought by
Brown Taylor B and Brown Anne M
Home Financials for this Owner
Home Financials are based on the most recent Mortgage that was taken out on this home.
Original Mortgage
$116,350
Interest Rate
3.74%
Mortgage Type
New Conventional
Create a Home Valuation Report for This Property
The Home Valuation Report is an in-depth analysis detailing your home's value as well as a comparison with similar homes in the area
Home Values in the Area
Average Home Value in this Area
Purchase History
| Date | Buyer | Sale Price | Title Company |
|---|---|---|---|
| Eubanks Nikki | $183,000 | -- | |
| Brown Taylor B | $183,400 | None Available |
Source: Public Records
Mortgage History
| Date | Status | Borrower | Loan Amount |
|---|---|---|---|
| Open | Eubanks Nikki | $183,000 | |
| Previous Owner | Brown Taylor B | $116,350 |
Source: Public Records
Tax History
| Year | Tax Paid | Tax Assessment Tax Assessment Total Assessment is a certain percentage of the fair market value that is determined by local assessors to be the total taxable value of land and additions on the property. | Land | Improvement |
|---|---|---|---|---|
| 2025 | $2,777 | $310,600 | $85,000 | $225,600 |
| 2024 | $2,668 | $312,400 | $73,500 | $238,900 |
| 2023 | $2,599 | $304,300 | $67,500 | $236,800 |
| 2022 | $2,122 | $248,500 | $52,500 | $196,000 |
| 2021 | $1,912 | $223,900 | $52,500 | $171,400 |
| 2020 | $1,854 | $217,100 | $55,000 | $162,100 |
| 2019 | $1,752 | $205,100 | $52,500 | $152,600 |
| 2018 | $1,581 | $194,700 | $55,000 | $139,700 |
| 2017 | $1,528 | $182,100 | $50,000 | $132,100 |
| 2016 | $1,525 | $181,800 | $50,000 | $131,800 |
| 2015 | $729 | $177,900 | $50,000 | $127,900 |
| 2014 | -- | $176,400 | $50,000 | $126,400 |
Source: Public Records
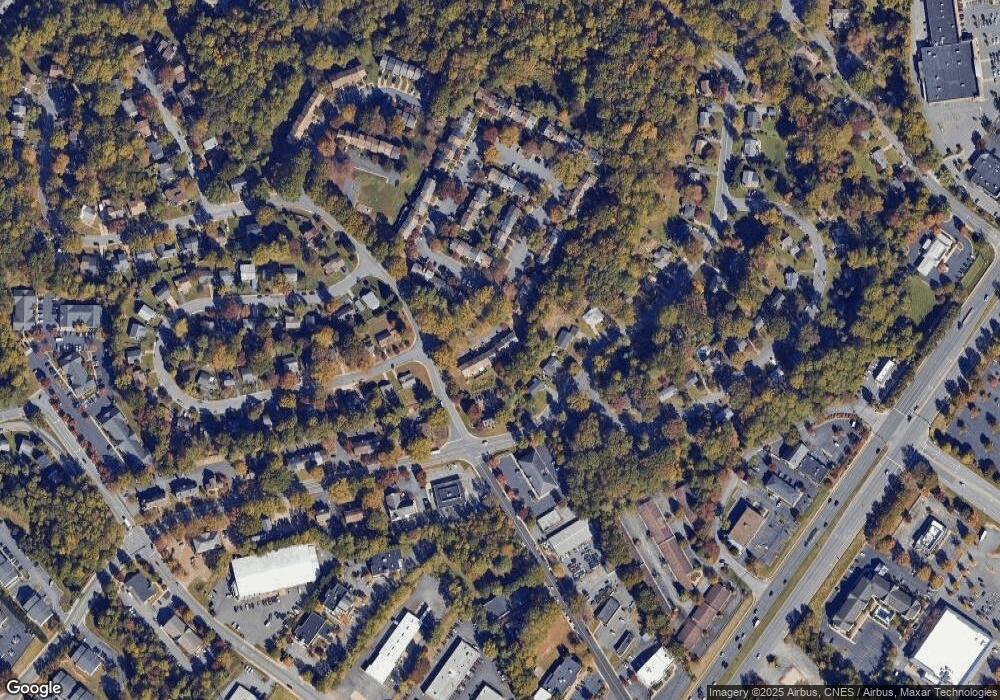
Map
Nearby Homes
- 439 Wynridge Dr
- 2417 Commonwealth Dr
- 1773 Webland View
- 1702 Webland Park
- 1594 Cool Spring Rd
- 1518 Birnam Dr
- 1325 Branchlands Dr Unit E
- 1545 Birnam Dr
- 143 Green Turtle Ln Unit 3
- 1614 Garden Ct
- TBD Seminole Trail
- 138 Green Turtle Ln Unit 12
- 139 Green Turtle Ln Unit 10
- 139 Green Turtle Ln Unit 8
- 1552 Garden Ct
- 1583 Birnam Dr
- 1703 Vermira Place
- 1104 Mill Park Drive Extension
- 1106 Mill Park Drive Extension
- 103 Turtle Creek Rd Unit 9
- 1388 Minor Ridge Ct
- 1384 Minor Ridge Ct
- 1382 Minor Ridge Ct
- 1390 Minor Ridge Ct
- 1380 Minor Ridge Ct
- 1378 Minor Ridge Ct
- 1376 Minor Ridge Ct
- 1400 Minor Ridge Ct
- 1374 Minor Ridge Ct
- 1402 Minor Ridge Ct
- 2401 Commonwealth Dr
- 2391 Commonwealth Dr
- 9A Fowler Ridge Ct
- 1404 Minor Ridge Ct
- 1542 Minor Ridge Ct
- 1406 Minor Ridge Ct
- 2375 Commonwealth Dr
- 1540 Minor Ridge Ct
- 1408 Minor Ridge Ct
- 2403 Commonwealth Dr
Your Personal Tour Guide
Ask me questions while you tour the home.