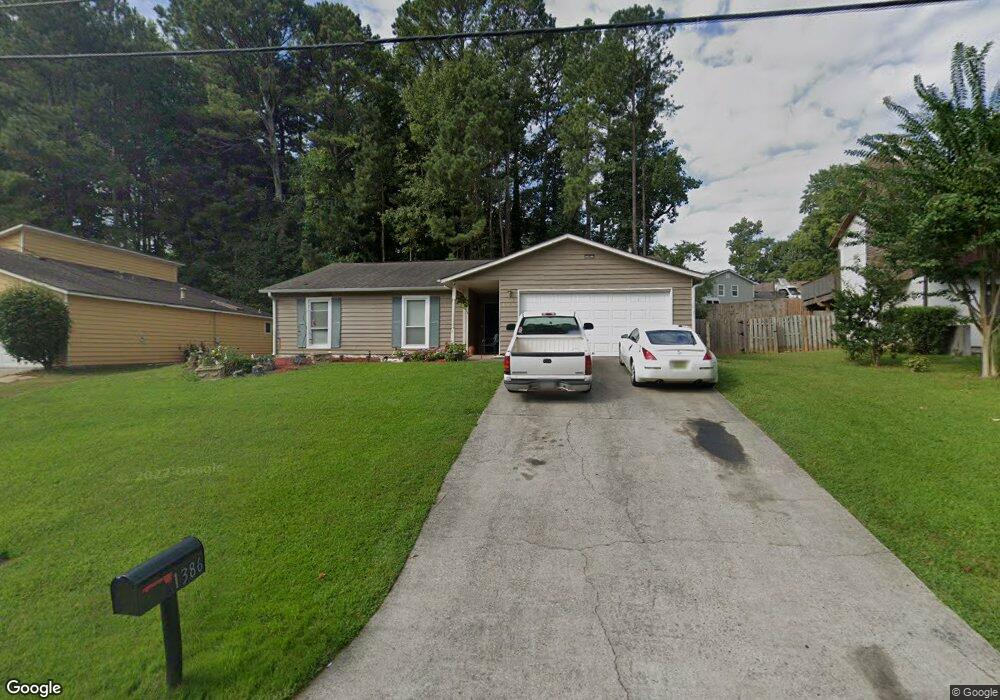
1386 Peninsula Trace Lawrenceville, GA 30044
Estimated Value: $311,000 - $332,000
3
Beds
2
Baths
1,580
Sq Ft
$205/Sq Ft
Est. Value
About This Home
This home is located at 1386 Peninsula Trace, Lawrenceville, GA 30044 and is currently estimated at $323,648, approximately $204 per square foot. 1386 Peninsula Trace is a home located in Gwinnett County with nearby schools including Corley Elementary School, Sweetwater Middle School, and Berkmar High School.
Ownership History
Date
Name
Owned For
Owner Type
Purchase Details
Closed on
May 25, 2007
Sold by
Cwabs Inc Series 2005-14
Bought by
Liunell Donald E
Current Estimated Value
Home Financials for this Owner
Home Financials are based on the most recent Mortgage that was taken out on this home.
Original Mortgage
$110,900
Outstanding Balance
$67,929
Interest Rate
6.12%
Mortgage Type
New Conventional
Estimated Equity
$249,608
Purchase Details
Closed on
Sep 5, 2006
Sold by
Arcila David
Bought by
Cwabs Inc Asset-Backed Certica
Purchase Details
Closed on
Dec 22, 2003
Sold by
Goldman Douglas A
Bought by
Vistnes Kjell and Vistnes Jennifer
Home Financials for this Owner
Home Financials are based on the most recent Mortgage that was taken out on this home.
Original Mortgage
$103,500
Interest Rate
4.62%
Mortgage Type
New Conventional
Purchase Details
Closed on
Dec 27, 2001
Sold by
Hudson Vivian J
Bought by
Goldman Douglas A
Purchase Details
Closed on
May 24, 1995
Sold by
Crowley Michael J Beandett
Bought by
Hudson Vivian
Create a Home Valuation Report for This Property
The Home Valuation Report is an in-depth analysis detailing your home's value as well as a comparison with similar homes in the area
Home Values in the Area
Average Home Value in this Area
Purchase History
| Date | Buyer | Sale Price | Title Company |
|---|---|---|---|
| Liunell Donald E | $110,900 | -- | |
| Cwabs Inc Asset-Backed Certica | $121,226 | -- | |
| Vistnes Kjell | $109,000 | -- | |
| Goldman Douglas A | -- | -- | |
| Hudson Vivian | $16,500 | -- |
Source: Public Records
Mortgage History
| Date | Status | Borrower | Loan Amount |
|---|---|---|---|
| Open | Liunell Donald E | $110,900 | |
| Previous Owner | Vistnes Kjell | $103,500 | |
| Closed | Hudson Vivian | $0 |
Source: Public Records
Tax History Compared to Growth
Tax History
| Year | Tax Paid | Tax Assessment Tax Assessment Total Assessment is a certain percentage of the fair market value that is determined by local assessors to be the total taxable value of land and additions on the property. | Land | Improvement |
|---|---|---|---|---|
| 2024 | $4,738 | $123,280 | $21,120 | $102,160 |
| 2023 | $4,738 | $120,040 | $24,000 | $96,040 |
| 2022 | $3,606 | $92,320 | $20,000 | $72,320 |
| 2021 | $2,756 | $67,520 | $14,280 | $53,240 |
| 2020 | $2,770 | $67,520 | $14,280 | $53,240 |
| 2019 | $2,671 | $67,520 | $14,280 | $53,240 |
| 2018 | $2,379 | $59,240 | $10,880 | $48,360 |
| 2016 | $1,609 | $42,600 | $9,600 | $33,000 |
| 2015 | $1,326 | $34,240 | $6,800 | $27,440 |
| 2014 | $1,331 | $34,240 | $6,800 | $27,440 |
Source: Public Records
Map
Nearby Homes
- 3955 Peninsula Ct
- 1455 Woodington Cir
- 1475 Woodington Cir
- 1331 Sweet Pine Dr
- 3871 Pleasant Oaks Dr Unit 59
- 4092 Anvil Ct Unit 2
- 3836 Pleasant Oaks Dr
- 4017 Heritage Valley Ct
- 4059 Heritage Valley Ct
- 3974 Stillwater Dr
- 4173 Stillwater Dr
- 4183 Stillwater Dr
- 3959 Stillwater Dr
- 1432 Shenta Oak Dr
- 1151 Overland Hill Trace
- 4089 Stillwater Dr
- 4096 Stillwater Dr Unit 4096
- 4118 Stillwater Dr Unit 4118
- 4023 Stillwater Dr
- 1640 Northgate Mill Dr
- 1396 Peninsula Trace
- 1376 Peninsula Trace
- 3934 Millstream Ct
- 1406 Peninsula Trace
- 1366 Peninsula Trace
- 3933 Millstream Ct
- 3944 Millstream Ct Unit II
- 1387 Peninsula Trace
- 1377 Peninsula Trace
- 1397 Peninsula Trace Unit 1397
- 1397 Peninsula Trace
- 1397 Peninsula Trace Unit 1
- 1416 Peninsula Trace
- 1356 Peninsula Trace
- 3945 Peninsula Ct Unit 21
- 1367 Peninsula Trace Unit 1
- 3943 Millstream Ct
- 3954 Millstream Ct
- 1407 Peninsula Trace
- 1489 Millstream Trail