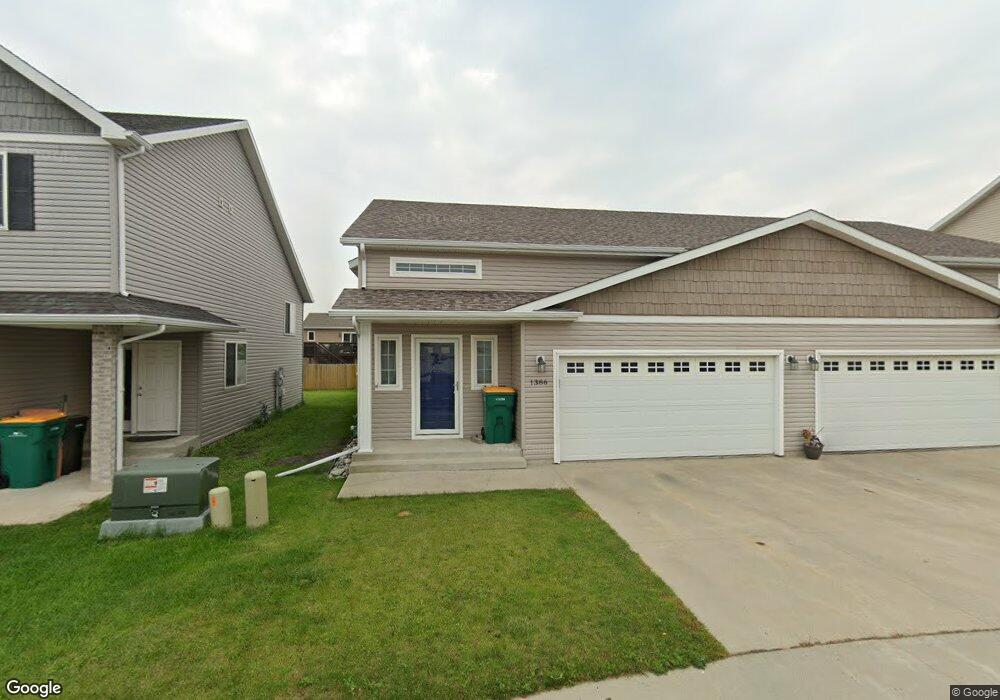
1386 Westport Beach Way West Fargo, ND 58078
Westport Beach NeighborhoodEstimated Value: $256,000 - $278,000
3
Beds
2
Baths
1,884
Sq Ft
$144/Sq Ft
Est. Value
About This Home
This home is located at 1386 Westport Beach Way, West Fargo, ND 58078 and is currently estimated at $271,620, approximately $144 per square foot. 1386 Westport Beach Way is a home located in Cass County with nearby schools including Legacy Elementary School, Liberty Middle School, and West Fargo Sheyenne High School.
Ownership History
Date
Name
Owned For
Owner Type
Purchase Details
Closed on
Sep 11, 2017
Sold by
Cole Jamee L and Cole Justin
Bought by
Sivertson Ross A and Bjerke Michelle L
Current Estimated Value
Home Financials for this Owner
Home Financials are based on the most recent Mortgage that was taken out on this home.
Original Mortgage
$152,232
Outstanding Balance
$127,227
Interest Rate
3.93%
Mortgage Type
New Conventional
Estimated Equity
$144,393
Purchase Details
Closed on
Apr 26, 2010
Sold by
Westport Beach Townhomes Llc
Bought by
Jordahl Custom Homes Inc
Purchase Details
Closed on
Jan 4, 2010
Sold by
Jordahl Custom Homes Inc
Bought by
Miller Jamee L
Home Financials for this Owner
Home Financials are based on the most recent Mortgage that was taken out on this home.
Original Mortgage
$127,503
Interest Rate
5.2%
Mortgage Type
FHA
Create a Home Valuation Report for This Property
The Home Valuation Report is an in-depth analysis detailing your home's value as well as a comparison with similar homes in the area
Home Values in the Area
Average Home Value in this Area
Purchase History
| Date | Buyer | Sale Price | Title Company |
|---|---|---|---|
| Sivertson Ross A | $190,290 | Regency Title | |
| Jordahl Custom Homes Inc | -- | -- | |
| Miller Jamee L | $129,900 | -- |
Source: Public Records
Mortgage History
| Date | Status | Borrower | Loan Amount |
|---|---|---|---|
| Open | Sivertson Ross A | $152,232 | |
| Previous Owner | Miller Jamee L | $127,503 |
Source: Public Records
Tax History Compared to Growth
Tax History
| Year | Tax Paid | Tax Assessment Tax Assessment Total Assessment is a certain percentage of the fair market value that is determined by local assessors to be the total taxable value of land and additions on the property. | Land | Improvement |
|---|---|---|---|---|
| 2024 | $2,939 | $118,900 | $16,100 | $102,800 |
| 2023 | $3,322 | $114,350 | $16,100 | $98,250 |
| 2022 | $3,020 | $102,650 | $16,100 | $86,550 |
| 2021 | $2,810 | $95,600 | $12,100 | $83,500 |
| 2020 | $2,675 | $92,450 | $12,100 | $80,350 |
| 2019 | $2,637 | $90,250 | $12,100 | $78,150 |
| 2018 | $2,579 | $91,750 | $12,100 | $79,650 |
| 2017 | $2,376 | $88,850 | $12,100 | $76,750 |
| 2016 | $3,056 | $86,500 | $12,100 | $74,400 |
| 2015 | $2,880 | $75,350 | $4,250 | $71,100 |
| 2014 | $2,846 | $70,400 | $4,250 | $66,150 |
| 2013 | $2,839 | $67,850 | $4,250 | $63,600 |
Source: Public Records
Map
Nearby Homes
- 1381 Westport Beach Way
- 1168 43rd Ave W
- 1236 S Beach Way
- 1156 42nd Ave W Unit A
- 1054 42nd Ave W
- 4509 11th St W
- 4507 Newport Ln
- 4717 11th St W
- 4534 Westport Pkwy
- 1040 39th Ave W
- 909 38 1 2 Ave W
- 4757 11th St W
- 1097 Hickory Ln
- 1089 Hickory Ln
- 1082 Larkin Ln
- 1052 50th Ave W
- 974 50th Ave W
- 951 50th Ave W
- 911 50th Ave W
- 5102 11th St W
- 1382 Westport Beach Way
- 1390 Westport Beach Way
- 1378 Westport Beach Way
- 1394 Westport Beach Way
- 1374 Westport Beach Way
- 1169 43rd Ave W
- 1216 44th Ave W
- 1389 Westport Beach Way
- 1385 Westport Beach Way
- 1210 44th Ave W
- 1381 Westport
- 1370 Westport Beach Way
- 1206 44th Ave W
- 1165 43rd Ave W
- 1222 44th Ave W
- 1377 Westport Beach Way
- 1202 44th Ave W
- 1366 Westport Beach Way
- 1161 43rd Ave W
- 1373 Westport Beach Way