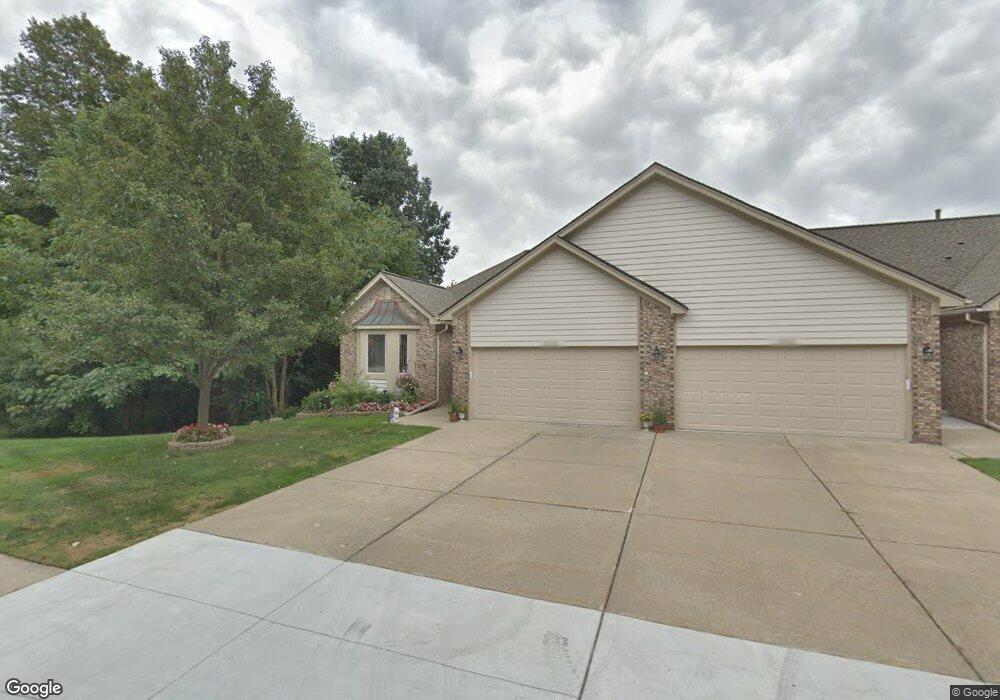
13860 Treeland Dr Unit 45 Shelby Township, MI 48315
Estimated Value: $280,534 - $324,000
2
Beds
2
Baths
1,368
Sq Ft
$221/Sq Ft
Est. Value
About This Home
This home is located at 13860 Treeland Dr Unit 45, Shelby Township, MI 48315 and is currently estimated at $302,884, approximately $221 per square foot. 13860 Treeland Dr Unit 45 is a home located in Macomb County with nearby schools including Flickinger Elementary School, Eppler Junior High School, and Utica High School.
Ownership History
Date
Name
Owned For
Owner Type
Purchase Details
Closed on
Oct 10, 2022
Sold by
Sawyer Shan M and Sawyer Rosetta
Bought by
Sawyer Rosetta and Elliot Dena L
Current Estimated Value
Purchase Details
Closed on
Aug 25, 2022
Sold by
Linda Khoury
Bought by
Mcclain Andrew R and Gill Alexis M
Purchase Details
Closed on
Nov 6, 2015
Sold by
Muharemovic Ibro
Bought by
Khoury Linda
Purchase Details
Closed on
Feb 12, 2010
Sold by
Catallo Rosa
Bought by
Catallo Giulio and Gualiteri Franca
Purchase Details
Closed on
Apr 30, 2002
Sold by
Shammas Matthew S
Bought by
Catallo Rosa
Create a Home Valuation Report for This Property
The Home Valuation Report is an in-depth analysis detailing your home's value as well as a comparison with similar homes in the area
Home Values in the Area
Average Home Value in this Area
Purchase History
| Date | Buyer | Sale Price | Title Company |
|---|---|---|---|
| Sawyer Rosetta | -- | -- | |
| Mcclain Andrew R | -- | -- | |
| Khoury Linda | $175,000 | None Available | |
| Catallo Giulio | -- | None Available | |
| Catallo Rosa | $192,500 | -- |
Source: Public Records
Tax History Compared to Growth
Tax History
| Year | Tax Paid | Tax Assessment Tax Assessment Total Assessment is a certain percentage of the fair market value that is determined by local assessors to be the total taxable value of land and additions on the property. | Land | Improvement |
|---|---|---|---|---|
| 2025 | $3,051 | $137,900 | $0 | $0 |
| 2024 | $1,806 | $127,500 | $0 | $0 |
| 2023 | $1,710 | $111,800 | $0 | $0 |
| 2022 | $2,759 | $102,100 | $0 | $0 |
| 2021 | $2,684 | $102,100 | $0 | $0 |
| 2020 | $1,575 | $99,700 | $0 | $0 |
| 2019 | $2,457 | $92,000 | $0 | $0 |
| 2018 | $2,427 | $90,900 | $0 | $0 |
| 2017 | $2,384 | $79,900 | $12,500 | $67,400 |
| 2016 | $2,367 | $79,900 | $0 | $0 |
| 2015 | $1,692 | $67,600 | $0 | $0 |
| 2012 | -- | $0 | $0 | $0 |
Source: Public Records
Map
Nearby Homes
- 45615 Silver Maple Ave
- 14430 Glenwood Dr
- 47040 W Wayford Dr
- 45678 Kennedy Ave Unit 4
- 47124 Rosevillage Ct
- 47136 Rosevillage Ct
- 14961 Stoney Brook Dr W
- 13000 Janine Ct
- 12212 Watkins Dr
- 15312 Ashley Ct
- 11705 Squiers Blvd Unit 114
- 15444 Roxbury Cir
- 56745 Spruce Forest Dr
- 14229 Mandarin Dr
- 11685 Squiers Blvd Unit 95
- 14257 Mandarin Dr
- 46386 Jackson Dr
- 15511 Huntcliff Dr
- 15090 Northpointe Dr
- 13199 Hazelnut Dr Unit 27
- 13860 Treeland Dr Unit 16 45
- 13860 Treeland Dr Unit 16
- 13860 Treeland Dr
- 13872 Treeland Dr
- 13872 Treeland Dr Unit 44
- 13890 Treeland Dr
- 13898 Treeland Dr
- 13865 Treeland Dr
- 13853 Treeland Dr
- 13865 Treeland Dr Unit 56
- 13816 Treeland Dr
- 13785 Maple Grove Ave Unit 45
- 13779 Maple Grove Ave
- 13791 Maple Grove Ave
- 13785 Maple Grove Ave Unit 4
- 13887 Treeland Dr
- 13899 Treeland Dr Unit Building 19, Unit
- 13899 Treeland Dr Unit 19 54
- 13899 Treeland Dr Unit 54
- 13899 Treeland Dr