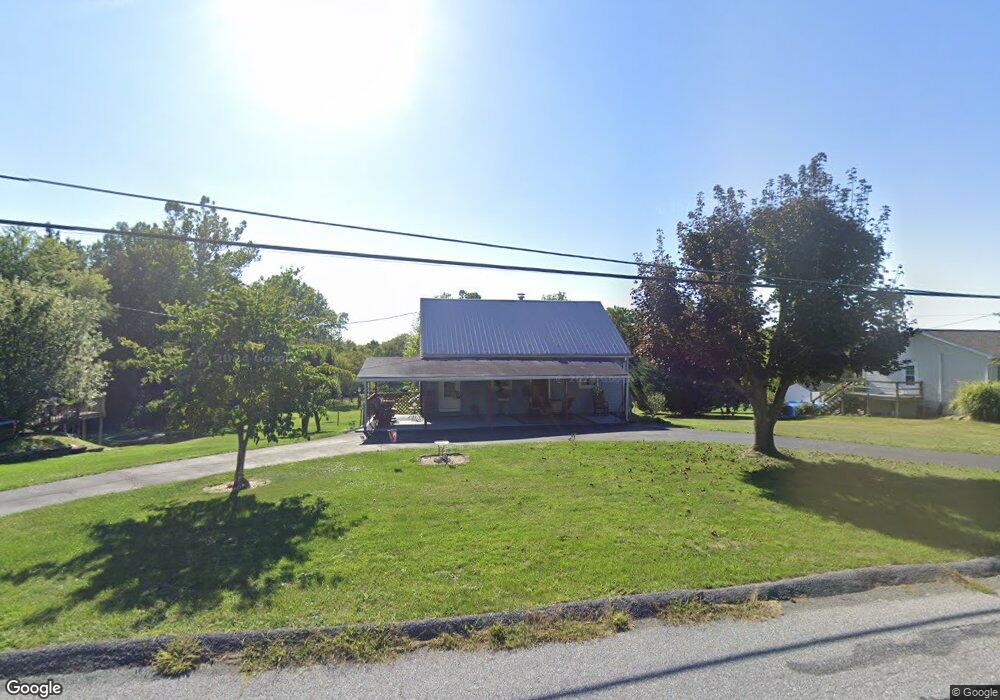
13865 Lower Edgemont Rd Waynesboro, PA 17268
Estimated Value: $97,811 - $212,000
--
Bed
--
Bath
768
Sq Ft
$218/Sq Ft
Est. Value
About This Home
This home is located at 13865 Lower Edgemont Rd, Waynesboro, PA 17268 and is currently estimated at $167,203, approximately $217 per square foot. 13865 Lower Edgemont Rd is a home located in Franklin County with nearby schools including Waynesboro Area Senior High School and CITY LIGHT SCHOOL.
Ownership History
Date
Name
Owned For
Owner Type
Purchase Details
Closed on
Jul 26, 2006
Sold by
Herrick Fred D and Herrick Carolyn M
Bought by
Herrick Fred D and Herrick Carolyn M
Current Estimated Value
Create a Home Valuation Report for This Property
The Home Valuation Report is an in-depth analysis detailing your home's value as well as a comparison with similar homes in the area
Home Values in the Area
Average Home Value in this Area
Purchase History
| Date | Buyer | Sale Price | Title Company |
|---|---|---|---|
| Herrick Fred D | -- | None Available |
Source: Public Records
Tax History Compared to Growth
Tax History
| Year | Tax Paid | Tax Assessment Tax Assessment Total Assessment is a certain percentage of the fair market value that is determined by local assessors to be the total taxable value of land and additions on the property. | Land | Improvement |
|---|---|---|---|---|
| 2025 | $1,571 | $10,230 | $680 | $9,550 |
| 2024 | $1,525 | $10,230 | $680 | $9,550 |
| 2023 | $1,480 | $10,230 | $680 | $9,550 |
| 2022 | $1,436 | $10,230 | $680 | $9,550 |
| 2021 | $1,396 | $10,230 | $680 | $9,550 |
| 2020 | $1,374 | $10,230 | $680 | $9,550 |
| 2019 | $1,343 | $10,230 | $680 | $9,550 |
| 2018 | $1,300 | $10,230 | $680 | $9,550 |
| 2017 | $1,272 | $10,230 | $680 | $9,550 |
| 2016 | $293 | $10,230 | $680 | $9,550 |
| 2015 | $273 | $10,230 | $680 | $9,550 |
| 2014 | $273 | $10,230 | $680 | $9,550 |
Source: Public Records
Map
Nearby Homes
- 13791 Springbrook Ave
- 13741 Villa View Dr
- 14090 Gardner Ave
- 0 Old Pen Mar Rd
- 12256 Old Pen Mar Rd
- 14547 Edgemont Rd
- 11378 Airport Rd
- 0 Skiway Ave Unit PAFL2023044
- 14611 Roosevelt Ave
- 0 Pen Mar High Rock Rd
- 10828 Buchanan Trail E
- 13189 Seneca Dr
- 13132 Ashton Dr Unit 11
- 11187 Bailey Springs Rd
- 14109 Edgemont Rd
- 10655 Bailey Springs Ln
- 10655 Bailey Springs Ln Unit 45
- 13365 Seibert Ave
- 11388 Valleywood Dr
- 25217 Elhuff Ct
- 13851 Lower Edgemont Rd
- 13973 Lower Edgemont Rd
- 13858 Lower Edgemont Rd
- 13829 Lower Edgemont Rd
- 13977 Lower Edgemont Rd
- 13880 Lower Edgemont Rd
- 12442 Stine Ave
- 13807 Lower Edgemont Rd
- 13882 Lower Edgemont Rd
- 12451 Stine Ave
- 13910 Springbrook Ave
- 13981 Lower Edgemont Rd
- 13878 Mar Pen Ave
- 12448 Stine Ave
- 13878 Lower Edgemont Rd
- 12316 Snyder Ave
- 12565 Stine Ave
- 13926 Lower Edgemont Rd
- 13823 Springbrook Ave
- 13936 Charles Dr