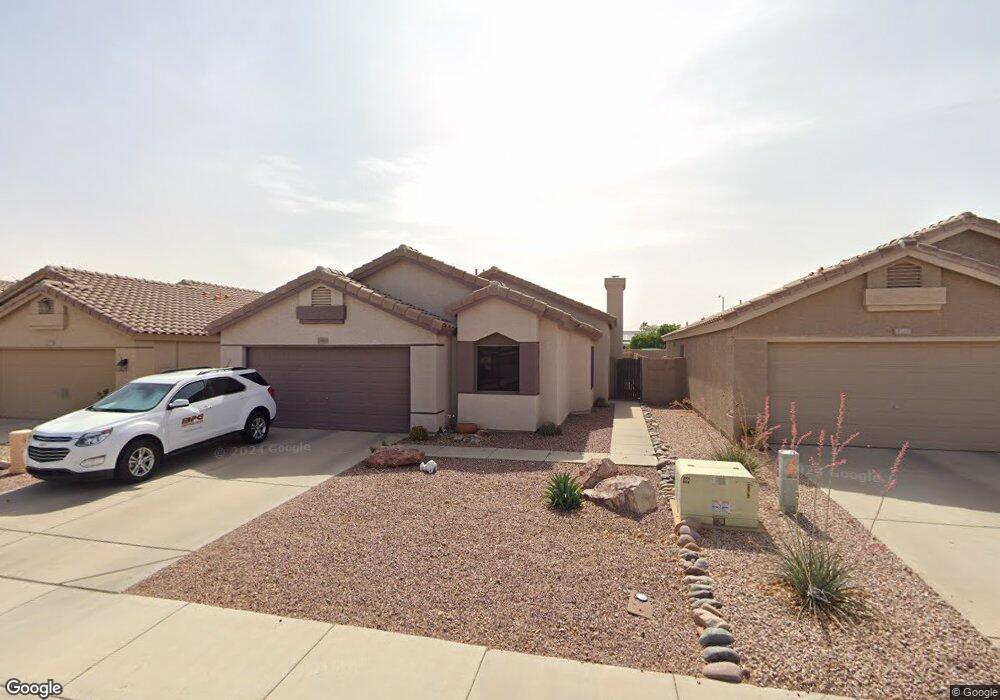
13868 N 91st Ln Peoria, AZ 85381
Estimated Value: $332,521 - $366,000
--
Bed
2
Baths
1,195
Sq Ft
$288/Sq Ft
Est. Value
About This Home
This home is located at 13868 N 91st Ln, Peoria, AZ 85381 and is currently estimated at $343,630, approximately $287 per square foot. 13868 N 91st Ln is a home located in Maricopa County with nearby schools including Desert Harbor Elementary School, Centennial High School, and Arrowhead Montessori.
Ownership History
Date
Name
Owned For
Owner Type
Purchase Details
Closed on
Sep 15, 2022
Sold by
Anne Fangman
Bought by
Peters Zachary and Troyer Kailee
Current Estimated Value
Home Financials for this Owner
Home Financials are based on the most recent Mortgage that was taken out on this home.
Original Mortgage
$294,500
Outstanding Balance
$280,764
Interest Rate
4.99%
Mortgage Type
New Conventional
Estimated Equity
$62,866
Purchase Details
Closed on
May 10, 2021
Sold by
Fangman Anne
Bought by
Fangman Anne and Troyer Kerry
Purchase Details
Closed on
Nov 25, 2019
Sold by
Fangman Anne and Estate Of Margaret L Mckelvey
Bought by
Fangman Anne
Purchase Details
Closed on
Jun 21, 1995
Sold by
Towne Development Inc
Bought by
Mckelvey Margaret L
Home Financials for this Owner
Home Financials are based on the most recent Mortgage that was taken out on this home.
Original Mortgage
$68,000
Interest Rate
7.48%
Mortgage Type
New Conventional
Create a Home Valuation Report for This Property
The Home Valuation Report is an in-depth analysis detailing your home's value as well as a comparison with similar homes in the area
Home Values in the Area
Average Home Value in this Area
Purchase History
| Date | Buyer | Sale Price | Title Company |
|---|---|---|---|
| Peters Zachary | $310,000 | Chicago Title | |
| Fangman Anne | -- | None Listed On Document | |
| Fangman Anne | -- | None Available | |
| Mckelvey Margaret L | $85,008 | United Title Agency |
Source: Public Records
Mortgage History
| Date | Status | Borrower | Loan Amount |
|---|---|---|---|
| Open | Peters Zachary | $294,500 | |
| Previous Owner | Mckelvey Margaret L | $68,000 |
Source: Public Records
Tax History Compared to Growth
Tax History
| Year | Tax Paid | Tax Assessment Tax Assessment Total Assessment is a certain percentage of the fair market value that is determined by local assessors to be the total taxable value of land and additions on the property. | Land | Improvement |
|---|---|---|---|---|
| 2025 | $1,410 | $14,806 | -- | -- |
| 2024 | $1,158 | $14,101 | -- | -- |
| 2023 | $1,158 | $26,800 | $5,360 | $21,440 |
| 2022 | $1,353 | $19,960 | $3,990 | $15,970 |
| 2021 | $1,415 | $18,100 | $3,620 | $14,480 |
| 2020 | $1,425 | $16,610 | $3,320 | $13,290 |
| 2019 | $1,185 | $15,150 | $3,030 | $12,120 |
| 2018 | $1,137 | $13,960 | $2,790 | $11,170 |
| 2017 | $1,138 | $12,660 | $2,530 | $10,130 |
| 2016 | $1,126 | $12,000 | $2,400 | $9,600 |
| 2015 | $1,051 | $11,830 | $2,360 | $9,470 |
Source: Public Records
Map
Nearby Homes
- 9232 W Arrowhead Dr
- 14217 N Bolivar Dr
- 9313 W Arrowhead Dr
- 9325 W Arrowhead Dr
- 14610 N Bolivar Dr
- 9430 W Arrowhead Dr
- 14407 N 75th Dr
- 14429 N 75th Dr
- 14566 N 90th Ln
- 9169 W Lisbon Ln
- 9420 W Shiprock Dr Unit 25
- 9413 W Raintree Dr
- 9405 W Rolling Hills Dr
- 9150 W Banff Ln
- 9519 W Timberline Dr
- 9295 W Wood Dr
- 13611 N 98th Ave Unit D
- 9429 W Rolling Hills Dr
- 9434 W Raintree Dr
- 9526 W Oakstone Dr
- 13872 N 91st Ln
- 13864 N 91st Ln
- 13876 N 91st Ln
- 13860 N 91st Ln
- 13825 N Boswell Blvd
- 13819 N Boswell Blvd
- 13856 N 91st Ln Unit B$500
- 13856 N 91st Ln
- 13880 N 91st Ln
- 13867 N 91st Ln
- 13831 N Boswell Blvd
- 13871 N 91st Ln
- 13863 N 91st Ln
- 13813 N Boswell Blvd Unit 25A
- 13875 N 91st Ln
- 13855 N 91st Ln
- 13837 N Boswell Blvd
- 9172 W Calavar Rd
- 13866 N 91st Dr
- 13870 N 91st Dr