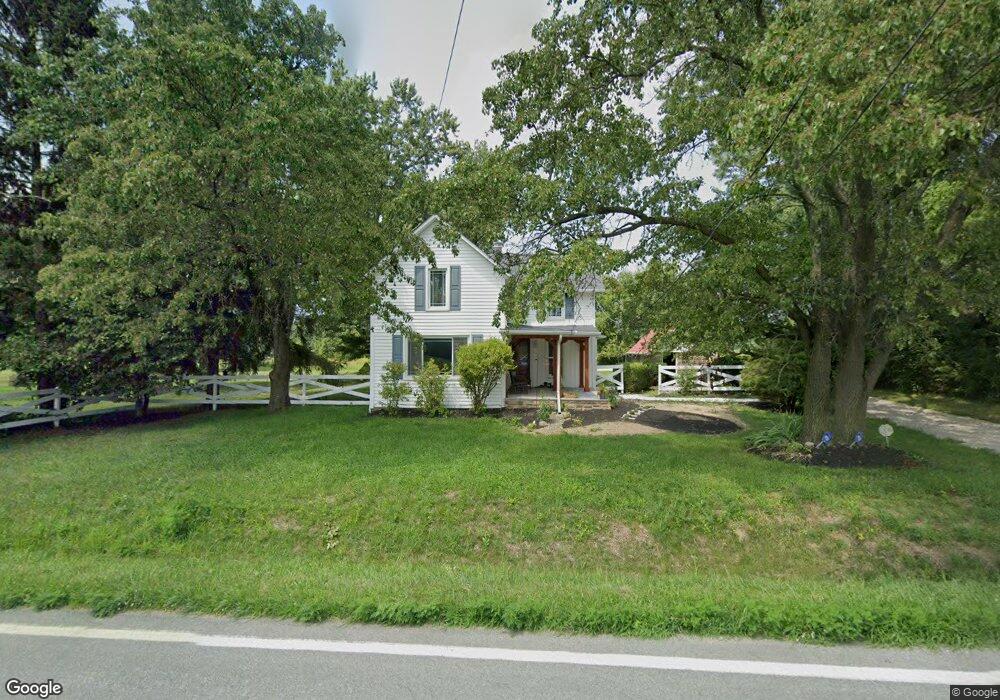
13871 Fancher Rd Westerville, OH 43082
Harlem NeighborhoodEstimated Value: $439,000 - $475,000
3
Beds
1
Bath
1,932
Sq Ft
$234/Sq Ft
Est. Value
About This Home
This home is located at 13871 Fancher Rd, Westerville, OH 43082 and is currently estimated at $452,414, approximately $234 per square foot. 13871 Fancher Rd is a home located in Delaware County with nearby schools including Hylen Souders Elementary School, Big Walnut Intermediate School, and Big Walnut Middle School.
Ownership History
Date
Name
Owned For
Owner Type
Purchase Details
Closed on
Jul 18, 2013
Sold by
Scheu Darren R and Scheu Angela M
Bought by
Scheu Angela M and Scheu Darren R
Current Estimated Value
Home Financials for this Owner
Home Financials are based on the most recent Mortgage that was taken out on this home.
Original Mortgage
$211,300
Outstanding Balance
$157,282
Interest Rate
4.49%
Mortgage Type
VA
Estimated Equity
$295,132
Purchase Details
Closed on
Jun 30, 2006
Sold by
Gerren Christopher S and Gerren Cari R
Bought by
Scheu Darren R and Provenzano Angela M
Home Financials for this Owner
Home Financials are based on the most recent Mortgage that was taken out on this home.
Original Mortgage
$45,600
Interest Rate
6.3%
Mortgage Type
Unknown
Purchase Details
Closed on
Jul 8, 1997
Sold by
Hettinga James D
Bought by
Gerren Christopher S and Gerren Carl R
Home Financials for this Owner
Home Financials are based on the most recent Mortgage that was taken out on this home.
Original Mortgage
$131,290
Interest Rate
8.01%
Mortgage Type
New Conventional
Create a Home Valuation Report for This Property
The Home Valuation Report is an in-depth analysis detailing your home's value as well as a comparison with similar homes in the area
Home Values in the Area
Average Home Value in this Area
Purchase History
| Date | Buyer | Sale Price | Title Company |
|---|---|---|---|
| Scheu Angela M | -- | None Available | |
| Scheu Darren R | $228,800 | Polaris Title | |
| Gerren Christopher S | $138,200 | -- |
Source: Public Records
Mortgage History
| Date | Status | Borrower | Loan Amount |
|---|---|---|---|
| Open | Scheu Angela M | $211,300 | |
| Closed | Scheu Darren R | $45,600 | |
| Closed | Scheu Darren R | $182,400 | |
| Closed | Gerren Christopher S | $131,290 |
Source: Public Records
Tax History Compared to Growth
Tax History
| Year | Tax Paid | Tax Assessment Tax Assessment Total Assessment is a certain percentage of the fair market value that is determined by local assessors to be the total taxable value of land and additions on the property. | Land | Improvement |
|---|---|---|---|---|
| 2024 | $5,295 | $122,330 | $30,170 | $92,160 |
| 2023 | $5,103 | $122,330 | $30,170 | $92,160 |
| 2022 | $4,323 | $88,520 | $21,110 | $67,410 |
| 2021 | $4,302 | $88,520 | $21,110 | $67,410 |
| 2020 | $4,316 | $88,520 | $21,110 | $67,410 |
| 2019 | $4,171 | $82,500 | $15,090 | $67,410 |
| 2018 | $3,940 | $82,500 | $15,090 | $67,410 |
| 2017 | $3,414 | $72,040 | $12,290 | $59,750 |
| 2016 | $3,189 | $72,040 | $12,290 | $59,750 |
| 2015 | $3,155 | $72,040 | $12,290 | $59,750 |
| 2014 | $3,260 | $72,040 | $12,290 | $59,750 |
| 2013 | $3,393 | $69,200 | $12,290 | $56,910 |
Source: Public Records
Map
Nearby Homes
- 0 Robins Rd Unit 223016518
- 15550 Evans Rd
- 7839 Peter Hoover Rd
- The Iris Residence Plan at Estates at Albany Acres
- Scarlett Custom Plan A at Estates at Albany Acres
- Kline Residence Plan at Estates at Albany Acres
- Ferryman Residence Plan at Estates at Albany Acres
- Ashford Plan at Estates at Albany Acres
- DeNiro Residence Plan at Estates at Albany Acres
- Izabella Plan at Estates at Albany Acres
- 7850 Peter Hoover Rd
- 0 Luna Unit Lot 10 225003340
- 0 Luna Unit Lot 9 225003339
- 8600 Steeple Wood Dr
- 6879 E Walnut St
- 0 Moonstone Unit Lot 12 225003342
- 0 Moonstone Unit Lot 11 225003341
- 0 Moonstone Unit Lot 5 225003337
- 0 Moonstone Unit LOT 4 225003335
- 0 Moonstone Unit LOT 3 225003334
- 0 Fancher Rd
- 75 Fancher Rd
- 13938 Fancher Rd
- 13935 Fancher Rd
- 13790 Fancher Rd
- 13820 Fancher Rd
- 13999 Fancher Rd
- 13765 Fancher Rd
- 13795 Fancher Rd
- 13750 Fancher Rd
- 13998 Fancher Rd
- 13715 Fancher Rd
- 13675 Fancher Rd
- 13633 Fancher Rd
- 14116 Fancher Rd
- 13590 Fancher Rd
- 13523 Fancher Rd
- 13542 Fancher Rd
- 13701 Bevelheimer Rd