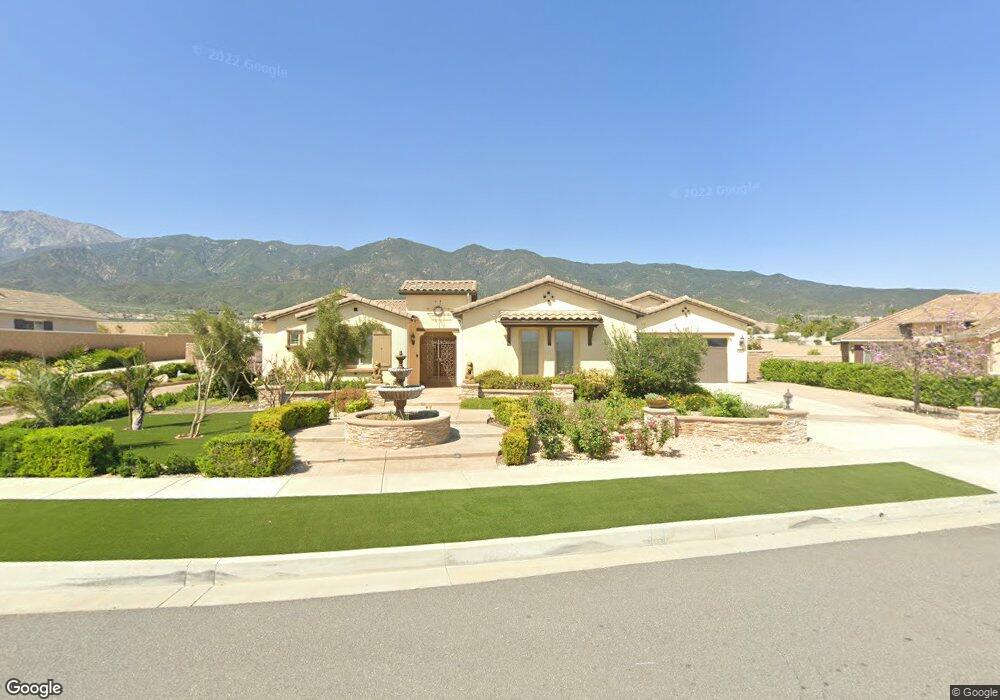
13878 Nash Dr Rancho Cucamonga, CA 91739
Etiwanda NeighborhoodEstimated Value: $1,339,000 - $1,841,000
About This Home
This home is located at 13878 Nash Dr, Rancho Cucamonga, CA 91739 and is currently estimated at $1,634,937, approximately $357 per square foot. 13878 Nash Dr is a home with nearby schools including Etiwanda Colony Elementary, Summit Intermediate, and Etiwanda High.
Ownership History
We collect this data history from publicly available records. To have your information removed, we recommend requesting removal directly through your county’s website.
Purchase Details
Purchase Details
Home Financials for this Owner
Home Financials are based on the most recent Mortgage that was taken out on this home.Home Values in the Area
Average Home Value in this Area
Purchase History
We collect this data history from publicly available records. To have your information removed, we recommend requesting removal directly through your county’s website.
| Date | Buyer | Sale Price | Title Company |
|---|---|---|---|
| -- | None Available | ||
| -- | None Available | ||
| $1,016,000 | First American Title |
Mortgage History
We collect this data history from publicly available records. To have your information removed, we recommend requesting removal directly through your county’s website.
| Date | Status | Borrower | Loan Amount |
|---|---|---|---|
| Open | $850,000 |
Tax History
We collect this data history from publicly available records. To have your information removed, we recommend requesting removal directly through your county’s website.
| Year | Tax Paid | Tax Assessment Tax Assessment Total Assessment is a certain percentage of the fair market value that is determined by local assessors to be the total taxable value of land and additions on the property. | Land | Improvement |
|---|---|---|---|---|
| 2025 | $14,043 | $1,254,190 | $240,370 | $1,013,820 |
| 2024 | $13,666 | $1,229,598 | $235,657 | $993,941 |
| 2023 | $13,347 | $1,205,488 | $231,036 | $974,452 |
| 2022 | $13,201 | $1,181,851 | $226,506 | $955,345 |
| 2021 | $12,982 | $1,158,678 | $222,065 | $936,613 |
| 2020 | $12,813 | $1,146,797 | $219,788 | $927,009 |
| 2019 | $12,464 | $1,124,310 | $215,478 | $908,832 |
| 2018 | $12,733 | $1,102,265 | $211,253 | $891,012 |
| 2017 | $12,170 | $1,080,652 | $207,111 | $873,541 |
| 2016 | $11,543 | $1,031,163 | $203,050 | $828,113 |
| 2015 | $10,800 | $968,097 | $147,897 | $820,200 |
Map
- 5657 Orion Place
- 5697 Orion Place
- 0 Wardman Bullock Rd
- 14178 Montclair Ct
- 13991 San Segundo Dr
- 13781 Breeders Cup Dr
- 13761 Breeders Cup Dr
- 5695 Pasadena Ct
- 5156 Branding Iron Place
- 13812 Breeders Cup Dr
- 13859 Oak Leaf Way
- 5715 Campanella Place
- 5075 Branding Iron Place
- 13939 Guidera Dr
- 14151 Vai Brothers Dr
- 13538 Applegate Ct
- 13558 Applegate Ct
- 4990 Padre Ave
- 14179 Henderson Dr
- 5848 Canter Cove Ct
- 13898 Nash Dr
- 13858 Nash Dr
- 5558 Capella Place
- 5541 Capella Place
- 13838 Nash Dr
- 5474 Wardman Bullock Rd
- 5561 Capella Place
- 5557 Orion Place
- 5578 Capella Place
- 5581 Capella Place
- 5577 Orion Place
- 13908 Annandale Ln
- 13818 Nash Dr
- 13911 Claremont Ln
- 5598 Capella Place
- 5542 Orion Place
- 5601 Capella Place
- 13916 Annandale Ln
- 5597 Orion Place
- 13923 Claremont Ln
Ask me questions while you tour the home.